{quote} Feel free to post, Mate. Looking forward to the nuggets you leave. Cheers!
Ignored
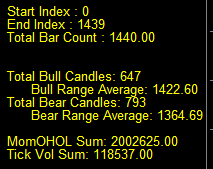
Progreesive sideways provides opportunities to make 10 to 20 pc gains a day if you use machine to shoot. Use mind to locate shooting positions and use the machine on those locations.
[q0.00uote=simnz;13918456]{quote} Progreesive sideways provides opportunities to make 10 to 20 pc gains a day if you use machine to shoot. Use mind to locate shooting positions and use the machine on those locations.[/quote]
High to low daily range is hardly one fourth of one per of total pips generated in 1440 minutes.if you target to tap sideways for 5 pc of total pips that means you can generate 0.0025 x 10 or 2.5 times of daily average easily by trading selectively for atleast 10 narrow range sideways zones.
You can compare boiling milk to 1440 minutes up and down pips and condensed milk to daily high low range. Try to find opportunities in boiling milk and not look for condensed milk.
|
Membership Revoked
|
Joined Nov 2020
|2,353 Posts
Attached Image (click to enlarge)
Attached Image (click to enlarge)
** I'm not promoting "my way of doing things" here. Merely showing how to measure and observe what your market does.
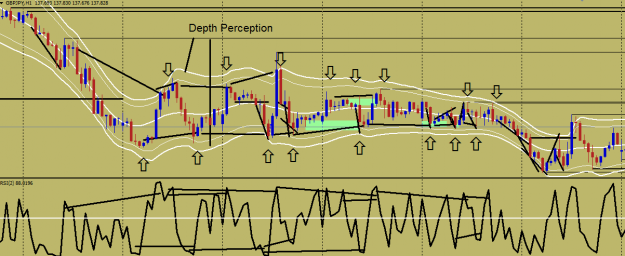
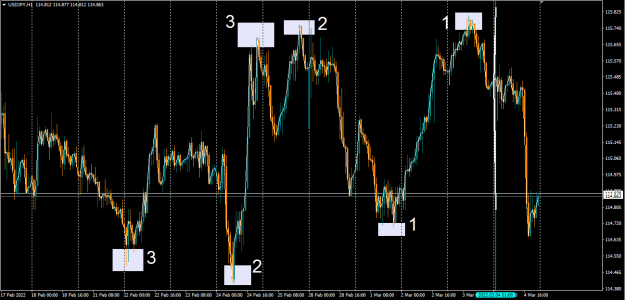
Over the years I have found using a counter trend line / Rate of change line is more instructive and insightful. Inline with this thread's strategy, please remember I am mainly a manual trader so I do not use trading EA's to do my work for me. Maybe for protection but not the input of orders. Lines shown on the chart pic - Taken from the initial pullback after a typical high. Taken from previous day's low. Taken from new low rollover after previous low is breached. From this perspective I have a lot to choose from re: situations to trade. I'm not sure how people programme an EA to trade counter to the usual/expected perception when their tools are pretty dumb, always seeking the 'trend'.
Hopefully these will help to understand this strategy better.
@ simnz - yes indeed that approach is a great way to carve out a day's work. But maybe a little too advanced for some. But I love how you carve it up. That's just me though.
@ Too Slow - I hope this is helpful. I know since I arrived here on FF etc, people have accused me of 'just drawing random lines' but really, how is it random when you track your prey ??!! Anyway, hope that helps.
|
Membership Revoked
|
Joined Nov 2020
|2,353 Posts
Just a quick note here also for people -
For 15mins TF (viewing and trading) and above ....
Every wick/spike/thin line protruding from top or bottom of "candlestick" is an opportunity to get in with market orders (limits are better but you may be out of luck getting filled there with them). Why? At an extreme like that, depending on the broker and their money providers up the river, you are primed to get all the movement for the activity you're looking to trade. How to do it? Look over your shoulder at previous activity. That's it. If it's been 'spikey' before, it is very likely to be spikey again. And again. And again. Spikes = smaller view. With a market order in that area, "liquidity is thin" (booohooo !! Ooooh No !!) Hehehe, sorry, That's for all those people who don't understand liquidity (Money) and love to winge and bitch about the "Us vs Them" mentality and still haven't paid attention. Market order = NOW. The VALUE of the Bid/Offer or a forward projection of that price value based on that need ie buy or sell INTO the market. NOT stopped out or cashed out of the market. So being at the most extreme price point AND then asking first for a limited fill for your order THEN activating the market order option guarantees a fill on your trade. Unless your broker is a floozy and cheat. Hehehehe.
That is how it's been done since the 1900's. Technology makes things pretty but the basics never change. Either you outbid someone or you offer a "better" price. That's the name of the game.
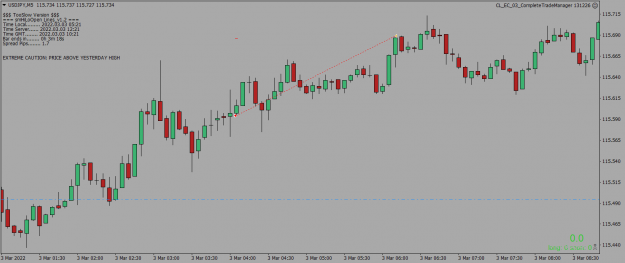
Added range, ATR(100) and percentage of range/ATR(100) to indicator message. The closer range gets to ATR, the more likely a reversal may happen. This may help those who struggle with this method. Wait for 50% or better to look for a reversal. Maybe that will help. Green pips to all. Cheers!
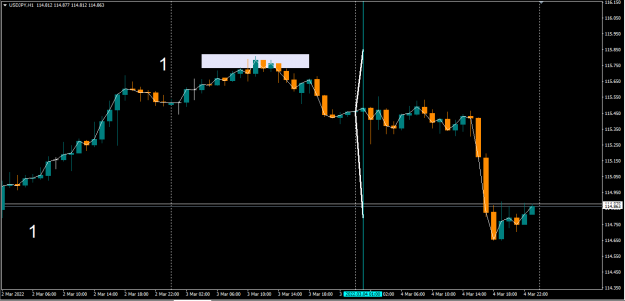
If I was learning this strategy from start, I would have a H1 chart with daily rollover marked. Day to day separator. From first open price of daily rollover, draw a very steep trend line up and one down. Almost vertical. The only other thing the market can do from there is go sideways til it gets bid down or it gets pushed up. Then mark the 3 days previous biggest highs and lows. NOW, bring in your template for HOLO and now just look. Successful trading is about opportunity seen before during after. Now look at your chart and list ALL the things...
Ignored
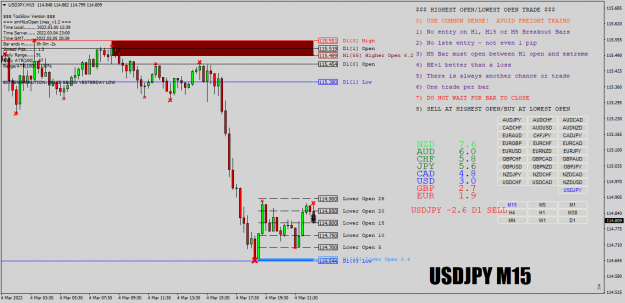
Please show us an example.
" From first open price of daily rollover, draw a very steep trend line up and one down. Almost vertical." Not sure what you mean here.
" mark the 3 days previous biggest highs and lows." Is that the same as daily high and daily low?
Attached Image (click to enlarge)
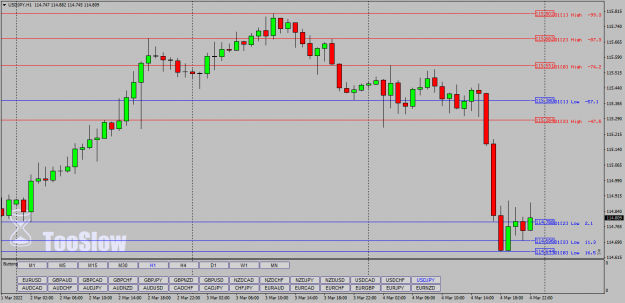
Chart has current and 3 previous day's daily high/daily low.
Thanks, Mate. Cheers!
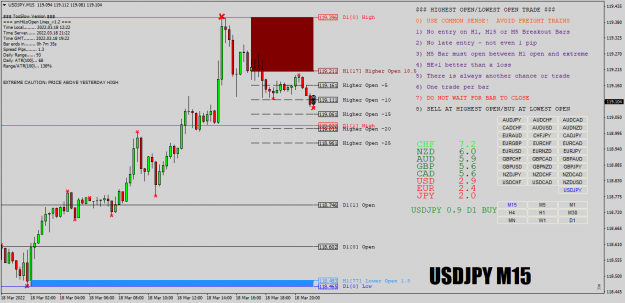
My Threads: Trading is as simple as 1-2-3, Highest Open / Lowest Open Trade
Progreesive sideways provides opportunities to make 10 to 20 pc gains a day if you use machine to shoot. Use mind to locate shooting positions and use the machine on those locations. High to low daily range is hardly one fourth of one per of total pips generated in 1440 minutes.if you target to tap sideways for 5 pc of total pips that means you can generate 0.0025 x 10 or 2.5 times of daily average easily by trading selectively for atleast 10 narrow range sideways zones. You can compare boiling milk to 1440 minutes up and down pips and condensed milk to daily high low range. Try to find opportunities in boiling milk and not look for condensed milk.
Ignored
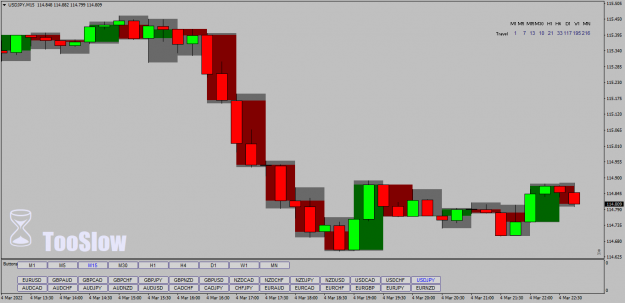
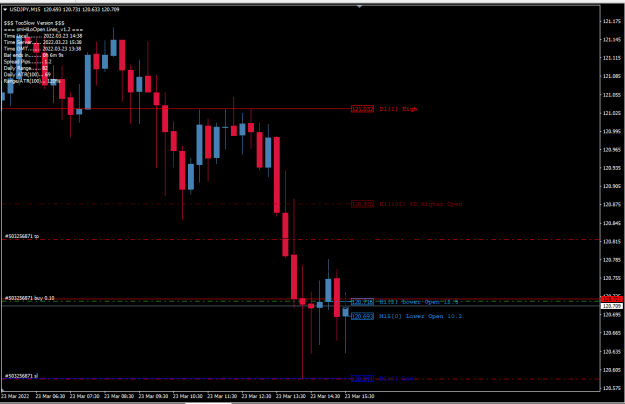
This sounds like the concept of price travel that I learned from #advancedalientrading . The lower the time frame, the greater the travel. Travel is defined as the range of the body ( open to close ) plus 2 times the range of the wicks ( High - Top ) and ( Bottom - Low ).
For a bullish candle, the price would move from open to low to high to close. One D1 candle would obviously have a lower travel than 1440 M1 candles.
Attached Image (click to enlarge)
Chart showing current travel for each chart period. The travel on M15 is greater than travel on M30.
My Threads: Trading is as simple as 1-2-3, Highest Open / Lowest Open Trade
{quote} Please show us an example. " From first open price of daily rollover, draw a very steep trend line up and one down. Almost vertical." Not sure what you mean here. " mark the 3 days previous biggest highs and lows." Is that the same as daily high and daily low? {image} Chart has current and 3 previous day's daily high/daily low. Thanks, Mate. Cheers!
Ignored
Attached Image (click to enlarge)
Attached Image (click to enlarge)
Since markets do what is needed, they don't always make a highest high or lowest Low each and every day. So an accumulated total of days is needed. I find 3 is enough. You'll see your market transition, or continue through this process without stress. Then mark the internal highs and lows situated within the limits of these highs/lows. Now you can superimpose the HOLO approach. Most people (And I do mean literally, most) have no idea how to use basic tools, expecting "new" to work "better" etc. I use daily rollover as a guide for the day coming. The very first hour is used with the vertical lineup. It's simple and works every time. ROC (rate of change) either begins with an overextended larger bar, has one within the middle of the movement or at the end of it. ROC in real life is the sum total AND individualized act of momentum ranging from extremely steep through to mildly steep then pure horizontal.
{quote} This sounds like the concept of price travel that I learned from #advancedalientrading . The lower the time frame, the greater the travel. Travel is defined as the range of the body ( open to close ) plus 2 times the range of the wicks ( High - Top ) and ( Bottom - Low ). For a bullish candle, the price would move from open to low to high to close. One D1 candle would obviously have a lower travel than 1440 M1 candles. {image} Chart showing current travel for each chart period. The travel on M15 is greater than travel on M30.
Ignored
I know you love to promote your twin brother Tro whom I like for having coded so many statistics indicators. You talked of something I did not think about it.
I meant 1440 minutes churning more than 99 times of the daily range pips (for DAX 40) when the rat-like jumps, made by the price movements, are counted.
{quote} This sounds like the concept of price travel that I learned from #advancedalientrading . The lower the time frame, the greater the travel. Travel is defined as the range of the body ( open to close ) plus 2 times the range of the wicks ( High - Top ) and ( Bottom - Low ). For a bullish candle, the price would move from open to low to high to close. One D1 candle would obviously have a lower travel than 1440 M1 candles. {image} Chart showing current travel for each chart period. The travel on M15 is greater than travel on M30.
Ignored
It is an interesting indicator.
Could you please post the indicator? Exe file if not mql.
Thank you.