Hello to everyone especially MQL coders. I have a request for an indicator as follow:
1-As we all know, the price of forex pairs are the products of multiplication or division of each other and so they are interconnected. for example EURUSD=EURJPY/USDJPY or EURUSD=EURAUD*AUDUSD
2-So it is important to understand the relative strength of currencies. Few indicators have been developed by MQL coders over years. Some of the good ones are: CurrencyStrengthAlerts, CCFp-Diff_[v2.0], CCFp, FFx_Universal_Strength_Meter, FOREX METER, Nihilist_CSM_mtf_V2, Nihilist_HolyGrail_Dash, Nihilist_Ultra_Trend_MP_DashBosrd, Nihilist_Ultra_ADX_Dash_ mtf. You can find others by searching. For example in this address you can find some: https://www.best-metatrader-indicato...or/#more-31040 . These indicators are doing their job fine but they are measuring strength via some indicator(except FerruFx's "FFx_Universal_Strength_Meter" that has a price option alongside some indicators. But this indicator standardize relative strength between currencies). But I'm looking for a naked-pips moved-relative-strength-indicator; something like below:
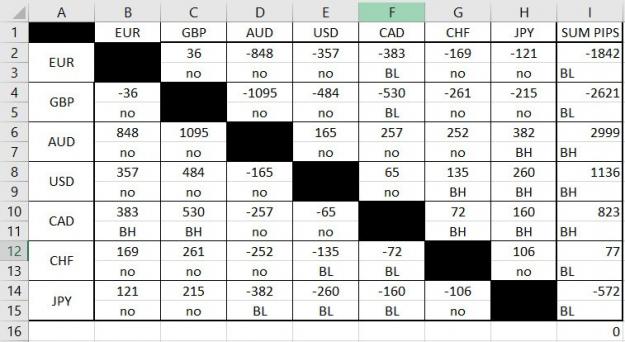
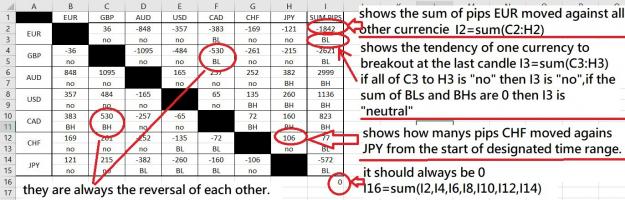
3-The above picture shows the appearance of the indicator. The currencies are arranged based on vertical and horizontal cells so we can compare their performance against each other(in pips). For example cell C2 shows how many pips EUR advanced, or declined, against GBP from the close price of 01/02/2022 to 11/03/2022. Cell C3 shows if price has broke out from the same time range(no means there is no breakout. BL means breakout low, and BH means breakout high).
There is a reversal of data around the black diagonal cells. So, for example, when cell F4 shows GBP declined -530 pips against CAD, cell C10 shows the opposite, and C11 shows a BH whereas F5 shows a BL.
Column "I" shows the sum of pips each currency moved since the start of designated time and if there is a tendency over BH or BL. For example cell I8 shows USD advanced 1136 pips against other currencies from 01/02/2022 to 11/03/2022 and cell I9 shows it has a BH tendency at the close of 11/03/2022. The breakout tendency is a simple addition of one currency breakouts; so if one currency has the same number of BLs and BHs, the cell should show "neutral". It is obvious that the sum of all pips moved in column "I" should be equal to 0.
4-The settings should consist of these:
no. of candles: how many candles the indicator should go back for the start point of measuring.
price mode: it could be the close price or current price, for close price it measures till the last closed candle, for current price it measures till last tick data.
timeframe: choose the timeframe of measuring
x pos: horizontal distance from edge of window in pixels
y pos: vertical distance from edge of window in pixels
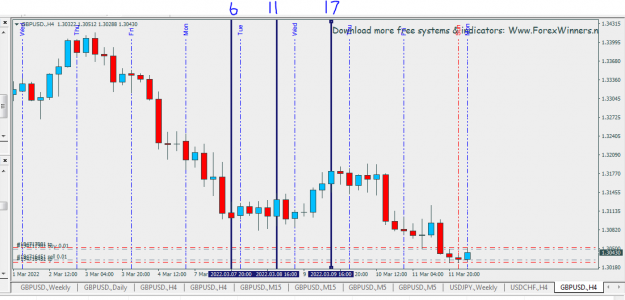
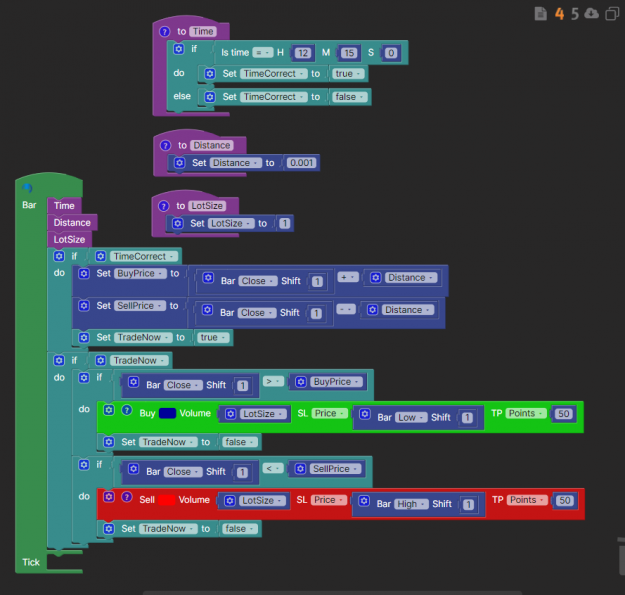
5- The idea came to me when I was reading "way of the turtle". The book is about the famous turtles of Richard Dennis. Their trading system was a breakout system consists of two related and similar systems. The first system's entry signal was a 20-day breakout, the second system's entry was a 55-day breakout. So for the final template I like to have two of this proposed indicator alongside each other but for different time ranges(or timeframes). something like below: 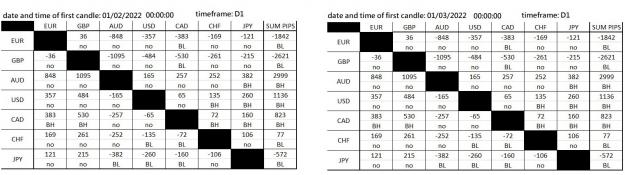
Thanks all of you for reading. If anyone is interested for coding this, I am more than willing to help in whatever way I can, if there is any vague points in my proposal, don's hesitate to ask, I will clarify it.
1-As we all know, the price of forex pairs are the products of multiplication or division of each other and so they are interconnected. for example EURUSD=EURJPY/USDJPY or EURUSD=EURAUD*AUDUSD
2-So it is important to understand the relative strength of currencies. Few indicators have been developed by MQL coders over years. Some of the good ones are: CurrencyStrengthAlerts, CCFp-Diff_[v2.0], CCFp, FFx_Universal_Strength_Meter, FOREX METER, Nihilist_CSM_mtf_V2, Nihilist_HolyGrail_Dash, Nihilist_Ultra_Trend_MP_DashBosrd, Nihilist_Ultra_ADX_Dash_ mtf. You can find others by searching. For example in this address you can find some: https://www.best-metatrader-indicato...or/#more-31040 . These indicators are doing their job fine but they are measuring strength via some indicator(except FerruFx's "FFx_Universal_Strength_Meter" that has a price option alongside some indicators. But this indicator standardize relative strength between currencies). But I'm looking for a naked-pips moved-relative-strength-indicator; something like below:
Attached Image (click to enlarge)
3-The above picture shows the appearance of the indicator. The currencies are arranged based on vertical and horizontal cells so we can compare their performance against each other(in pips). For example cell C2 shows how many pips EUR advanced, or declined, against GBP from the close price of 01/02/2022 to 11/03/2022. Cell C3 shows if price has broke out from the same time range(no means there is no breakout. BL means breakout low, and BH means breakout high).
There is a reversal of data around the black diagonal cells. So, for example, when cell F4 shows GBP declined -530 pips against CAD, cell C10 shows the opposite, and C11 shows a BH whereas F5 shows a BL.
Column "I" shows the sum of pips each currency moved since the start of designated time and if there is a tendency over BH or BL. For example cell I8 shows USD advanced 1136 pips against other currencies from 01/02/2022 to 11/03/2022 and cell I9 shows it has a BH tendency at the close of 11/03/2022. The breakout tendency is a simple addition of one currency breakouts; so if one currency has the same number of BLs and BHs, the cell should show "neutral". It is obvious that the sum of all pips moved in column "I" should be equal to 0.
Attached Image (click to enlarge)
no. of candles: how many candles the indicator should go back for the start point of measuring.
price mode: it could be the close price or current price, for close price it measures till the last closed candle, for current price it measures till last tick data.
timeframe: choose the timeframe of measuring
x pos: horizontal distance from edge of window in pixels
y pos: vertical distance from edge of window in pixels
5- The idea came to me when I was reading "way of the turtle". The book is about the famous turtles of Richard Dennis. Their trading system was a breakout system consists of two related and similar systems. The first system's entry signal was a 20-day breakout, the second system's entry was a 55-day breakout. So for the final template I like to have two of this proposed indicator alongside each other but for different time ranges(or timeframes). something like below:
Attached Image (click to enlarge)
Thanks all of you for reading. If anyone is interested for coding this, I am more than willing to help in whatever way I can, if there is any vague points in my proposal, don's hesitate to ask, I will clarify it.