Disliked{quote} Yes, I did, and I saw your indicator on the chart, and I noticed it wasn't good. I also checked the BW system I posted, and I saw that again, the patterns taken out of context mean nothing, and are often too late. So, I thought that those patterns are relatively easy and only 3, so it's not a big deal to learn them and apply when the chart context is right. The Saucer patterns are useful as trend continuation signals, like a wave that is intesifying. The Cross patterns are basically where your markers are. The Twin Peaks patterns are basically...Ignored
DislikedToo much information on one chart is just as bad as too little. One must find a perfect balance.Ignored
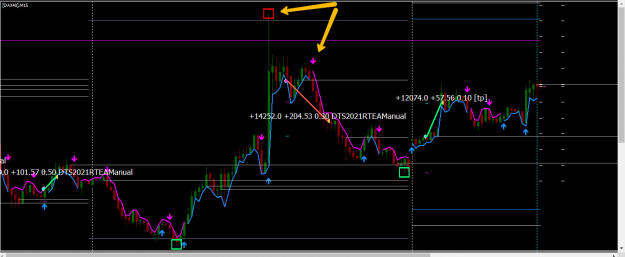
![Click to Enlarge
Name: [DAX40]M15.jpg
Size: 506 KB](/attachment/image/4162907/thumbnail?d=1647167374)
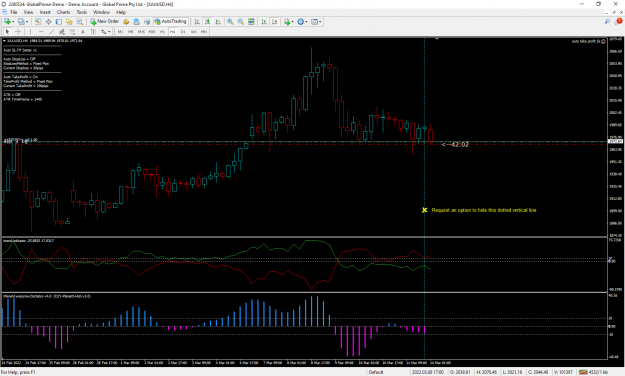
![Click to Enlarge
Name: [DAX40]M15.jpg
Size: 502 KB](/attachment/image/4163286/thumbnail?d=1647242322)