• Home
  • Forums
  • Trades
  • News
  • Calendar
  • Market
  • Brokers
  • Login
  • Join
  • User/Email: Password:
  • 7:58pm
Menu
  • Forums
  • Trades
  • News
  • Calendar
  • Market
  • Brokers
  • Login
  • Join
  • 7:58pm
Sister Sites
  • Metals Mine
  • Energy EXCH
  • Crypto Craft

Options

Bookmark Thread

First Page First Unread Last Page Last Post

Print Thread

Similar Threads

I will code your scalping EAs for no charge 71 replies

Need help to code EAs for MT4 and MT5 5 replies

I will code your pivot EAs for no charge 20 replies

EAs and indicators relating to moutaki... 22 replies

InterbankFX has loaded its MT4 platform with custom EAs, indicators and scripts 1 reply

  • Platform Tech
  • /
  • Reply to Thread
  • Subscribe
  • 42,365
Attachments: I will code your EAs and Indicators for no charge
Exit Attachments
Tags: I will code your EAs and Indicators for no charge
Cancel

I will code your EAs and Indicators for no charge

  • Last Post
  •  
  • 1 25372538Page 253925402541 3077
  • 1 Page 2539 3077
  •  
  • Post #50,761
  • Quote
  • Feb 1, 2022 11:46am Feb 1, 2022 11:46am
  •  zizoo
  • | Joined Sep 2009 | Status: Member | 167 Posts
Quoting Egbert
Disliked
{quote} You are a joke...... Pivot Thread is open for anybody to post. {image}
Ignored
If I could post there, why did I choose another thread?

I'm sorry to bother you.

Good luck
when you can accurately predict the future, you leave nothing to chance.
 
 
  • Post #50,762
  • Quote
  • Feb 1, 2022 3:27pm Feb 1, 2022 3:27pm
  •  subraghu
  • | Joined Apr 2019 | Status: Member | 33 Posts
Quoting JBRolim
Disliked
Hello coders, I have an idea to be realized if possible, I hope from your skills and knowledge you will tell me if this is possible? Below is a chart with dual plotted indicator (TMA+CG mladen) {image}The idea is to have two channels with separate settings for each one, also add to this indicator a standard moving average with your settings. EVERY time the MM line crosses the first line of the first channel, the red color opens a bearish arrow, if it crosses the red line of the other channel, it opens another bearish arrow. {image} EVERY time the...
Ignored
Really awesome strategy......superb
 
1
  • Post #50,763
  • Quote
  • Feb 1, 2022 6:56pm Feb 1, 2022 6:56pm
  •  simnz
  • Joined Nov 2015 | Status: Member | 2,525 Posts
Quoting daengrani07
Disliked
{quote} I encouraged any mt4 trader to start using mt5. It has many free stuff. With a little basic knowledge (i posted the link where to learn mql5), we could edit some free- ready-made EAs, indis, libraries take a look at this link, and this, and this, and this, definitely this series, and...
Ignored
Kudos to you for motivating learners and extending help to them. May God bless you.
Practice makes a person perfect
 
 
  • Post #50,764
  • Quote
  • Feb 1, 2022 11:27pm Feb 1, 2022 11:27pm
  •  Treptrader
  • Joined Jan 2022 | Status: Member | 139 Posts
Quoting sosariesgo
Disliked
Hello Comunity of traders i need help coding this indicator to an EA B_v2_MACD_OSMAX This Test works in M15 getting 5 pips General Rules 1) Check maximum operation open at the same time Ex 10 operations USDCAD 1 sell and 1 buy USDJPY 1 sell o 1 buy GBPUSD 1 sell o 1 buy CHFNZD 1 sell o 1 buy EURUSD 1 sell o 1 buy Define ID of the EA to count the open operations and not open more than the defined 10 operations 2) External variable to define Pips of profit 3) External variable to define lot size per operation 4) External variable to check spread Ex...
Ignored
message me so i can get some details from u. its almost finished
 
 
  • Post #50,765
  • Quote
  • Feb 2, 2022 12:15am Feb 2, 2022 12:15am
  •  simnz
  • Joined Nov 2015 | Status: Member | 2,525 Posts
Quoting daengrani07
Disliked
{quote} i'm tired typing code right now. this version is not completed for order manager yet, i'll continue later just check the 3 buttons (hide/show) rectangle lRect = Long Rectangle (for Buylimit only) mRect = Middle Rectangle (for buystop/sellstop) sRect = Short Rectangle (for SellLimit only) {file} {image}
Ignored
You have an aesthetic sense of designing. Can MT5 buttons be easily replicated in mql4?
I like your concept of printing rectangular shadows on top, middle, bottom for help in decision making.

If convenient for you, can you please provide mql5 indicator to get an idea of your porting it to mql4.

What I do manually is :

1. Locate Sideways or Breakout probability based on my experience and probability statistics generated.
Probability of pullbacks, probability of continuation, probability of reversals.

No technical indicators can forecast whether it is going to be sideways or breakout. History statistics can give an idea for making assumptions.
In trading, you can only make assumptions.

2. I use Master Grid and Mini Grid concept. Select a Range for Master grid with its TP and Equity Loss. Define number of mini grids in between the Master Grid with own TP (SL is not used)

For Buy: Top Long will be TP line and Bottom of it for the Equity Loss. For Sell the order is reversed. Top Rally for Equity Loss and Bottom Rally for Profit Taking.
3. For mini grids each with a TP only I use my own Start Price to draw grids of Pending Orders above and below it. If the price is not input, it will default to the current market price.
4. There could be two Steps above Start Price and 6 steps below Start Price. All left to me . Each step could have either constant lot size or the weightage increased by more than 1 number of constant size. I don't trade Martingale but when I feel the breakout is going to happen I will trade top HP with more lots (say 6 lots). If I feel it is going to be Sideways affair, I will choose to have steps with equal-sized lots.
5. I use Pending Order lines to make changes by dragging the lines on the screen . Mouse facility will be welcome.
6. MT5 facilitates Data window which could be hidden or displayed on the screen by way of Tabs .
7. Buttons may be for Selection of Start and Close time, Lots, Steps of Pending Lines, Delete Pending Orders (all buy , all sell, or ALL) , Close Market Orders (with profit , with loss) CLOSE ALL pending orders as well as Market orders or Close all with Stop Time. An option to open TP for revisits . In my experience during compressed consolidation, sometimes the price positions are revisited even 50 times in a period of H4. Each revisit after taking TP should be able to reopen TP on revisits for
8. EA has a symbol as well as magic number plus comments line for inputs.
9.Simple risk management to be activated by Trailing Profit and Breakeven, Drawdown control by Margin % .

Data Window

1. General Data window to show Pips from Open, Trades open: Long, short , Average price for sells and buys, Trades completed, Balance and the equity, Margin%, Current Profit, all profit for today,Pips from Daily Open, ADR from Open, Day Range , Today's daily high range.
2. Trades Data window shows movements between Pending Orders and TP by highlight the grid dynamically and records number of revisits made and Pips generated by revisits only.
Practice makes a person perfect
 
 
  • Post #50,766
  • Quote
  • Feb 2, 2022 12:19am Feb 2, 2022 12:19am
  •  ykpuffy07
  • | Joined Jan 2010 | Status: Member | 236 Posts
please can anyone help with why this indicator isn't showing anything when attached to the chart. If anyone have similar indicator that works just like this, i will really appreciate. Attached is a screenshot of what it looks like. However, when attached to the chart it isn't showing anything
Attached Image (click to enlarge)
Click to Enlarge

Name: screenshot.png
Size: 383 KB
Attached File(s)
File Type: ex4 lwma-buy-sell-arrows-indicator.ex4   33 KB | 293 downloads
 
2
  • Post #50,767
  • Quote
  • Feb 2, 2022 4:50am Feb 2, 2022 4:50am
  •  ffss
  • | Joined Jul 2020 | Status: Member | 123 Posts
Quoting subraghu
Disliked
{quote} Really awesome strategy......superb
Ignored
But arent those tma bands repainting?

https://im5.ezgif.com/tmp/ezgif-5-531a2bbdc1.gif
Attached Image (click to enlarge)
Click to Enlarge

Name: ezgif-5-531a2bbdc1.gif
Size: 3.3 MB
 
 
  • Post #50,768
  • Quote
  • Feb 2, 2022 7:16am Feb 2, 2022 7:16am
  •  charli86
  • Joined Jan 2017 | Status: Member | 618 Posts
Quoting ffss
Disliked
{quote} But arent those tma bands repainting? https://im5.ezgif.com/tmp/ezgif-5-531a2bbdc1.gif {image}
Ignored
Use this one instead,different results of course
Attached File(s)
File Type: ex4 TMA CG never repaint.ex4   30 KB | 284 downloads
 
2
  • Post #50,769
  • Quote
  • Feb 2, 2022 8:09am Feb 2, 2022 8:09am
  •  Musharib
  • | Joined Nov 2021 | Status: Member | 51 Posts
hello does anyone know how to make shotcut key to delete a spacific level of fibonacci retrecment
 
 
  • Post #50,770
  • Quote
  • Feb 2, 2022 12:34pm Feb 2, 2022 12:34pm
  •  Shakka
  • | Joined Jun 2017 | Status: Superior | 154 Posts
Hi All..
I need an EA that can set a buy stop and sell stop order by distance at the opening price of a candle X (X means specific hour).
For example:
Open price candle of 12:33 is 1.12345
If I set the distance by 20 pips (200 points), then EA should set buy stop at 1.12545 and sell stop at 1.12145

The specific hour, distance, and lot size can be changeable. Can someone help to create or share it if you have one please?

Best regards, Shakka.
Gambling = 0% skill, 100% luck. Trading = 1% skill, 99% luck.
 
 
  • Post #50,771
  • Quote
  • Feb 2, 2022 2:28pm Feb 2, 2022 2:28pm
  •  xxl205
  • | Joined Aug 2010 | Status: Member | 151 Posts
Hi all,

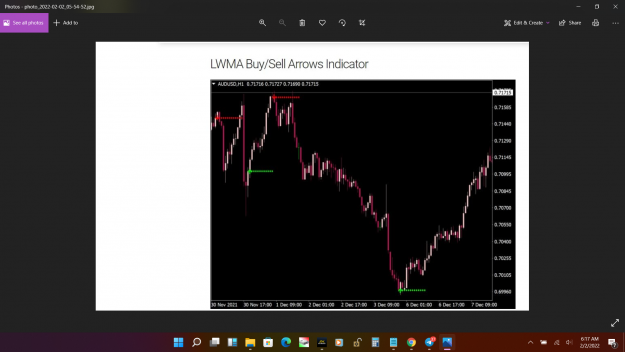
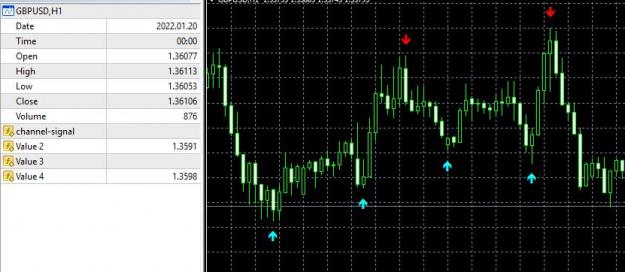
I'm just not getting my head around reading out this channel-signal indicator.

I've got only the .ex4 file, no source, and I do not know where from. So all credits to the owner.

I know that it repaints. But the higher the TF and the better the settings (I use 35/21 instead of default 21/14), the more precise it gets of course.

Could someone post the iCustom(...) settings, pleeeeeeeease ?

Intelligence I've understood so far :

When I hover over an arrow it has painted, the DATA WINDOW shows DOWN values in row 1 and 3 or both, UP values in 2 and 4 or both.
Give it a go and you experienced guys will understand immediatly for sure ^^

Cheers, XXL205 George
Attached Image (click to enlarge)
Click to Enlarge

Name: channel-signal.JPG
Size: 72 KB
Attached File(s)
File Type: ex4 channel-signal.ex4   8 KB | 186 downloads
"We are all just prisoners ... of our own device ..." (Hotel California)
 
 
  • Post #50,772
  • Quote
  • Feb 2, 2022 4:18pm Feb 2, 2022 4:18pm
  •  loki177
  • | Joined Oct 2019 | Status: Member | 8 Posts
Quoting xxl205
Disliked
Hi all, I'm just not getting my head around reading out this channel-signal indicator.
Ignored
two types of arrows - strong and weak trend
Attached Image (click to enlarge)
Click to Enlarge

Name: channel-signal.jpg
Size: 69 KB
Attached File(s)
File Type: mq4 channel-signal.mq4   9 KB | 317 downloads
 
2
  • Post #50,773
  • Quote
  • Edited 5:36pm Feb 2, 2022 5:16pm | Edited 5:36pm
  •  xxl205
  • | Joined Aug 2010 | Status: Member | 151 Posts
Quoting loki177
Disliked
{quote} two types of arrows - strong and weak trend {file} {image}
Ignored
Oh, wow ! That was a quick one. Doesn't look like a decompiled code

Well, THANK YOU A LOT ! Now as I'm no coder I'll see what to do with it.

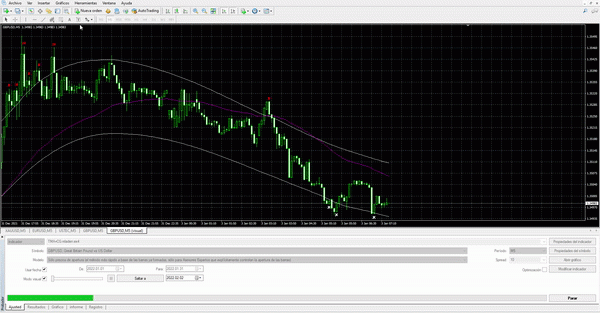
This is my manual setup, now a bit cluttered with those colorful arrows and dots, but you get the idea :

1. Wait for a triple setup from the red box END OF TREND indi and the channel-signal.
2. Take the NEXT CANDLE on CLOSE after FIRST ARROW from channel-signal after the RED BOX (countertrending) for some confirmation.
3. More confirmation if FXCorrelator tells you a delta of 50+ (white line)
4. SL somewhere under/over the entry, around 10-15pips.

Ultra best exit on opposite signal, or any in between according to personal targets or available screentime.

See why an EA would be much needed here ? ^^ Just to play the values and see if that baby has (semi/automated) legs.

Manually I'm riding this in overall direction of the W1
(GBP would have been short on W1 but long on D1 thus mixed signals but DELTA from FXCorrelator way over 50 made D1 valid).

DISCLAIMER : all the indicators here will bite you, they repaint like crazy. But if you add them up like this, you may trade any chart, any timeframe.
The higher TF the better the repaint issues. It's a game of chances anyway, just trying to narrow it down.
Attached Image (click to enlarge)
Click to Enlarge

Name: M15 Setup.JPG
Size: 521 KB
Attached File(s)
File Type: ex4 CCFp-Diff_[v2.0-MTF].ex4   116 KB | 171 downloads
File Type: mq4 channel-signal new.mq4   9 KB | 250 downloads
File Type: ex4 CO_NL_END_OF_TREND.ex4   15 KB | 185 downloads
File Type: mq4 FXCORRELATOR_BASIC_FREE_VERSION_2019_2.mq4   21 KB | 226 downloads
"We are all just prisoners ... of our own device ..." (Hotel California)
 
3
  • Post #50,774
  • Quote
  • Feb 2, 2022 5:25pm Feb 2, 2022 5:25pm
  •  mntiwana
  • Joined Mar 2013 | Status: Member | 2,425 Posts
Quoting adnanc
Disliked
Greetings to all! Does anyone know where I can find the mq4 file to the Chandelier Stops Indicator? This will be most helpful! {file} {image}
Ignored
There are several versions a kind of variations of it
it is too old
alternatively you can find/use atr stop,nrtr atr stop,trend envelop,bb stop,almost same thing,same way displaying
better to find latest bb stop ver that includes much more to experiment
 
1
  • Post #50,775
  • Quote
  • Feb 3, 2022 1:24am Feb 3, 2022 1:24am
  •  simnz
  • Joined Nov 2015 | Status: Member | 2,525 Posts
Quoting daengrani07
Disliked
{quote} If your need become too complex, you need to learn some basic coding. I suggest learn mql5, here a good start
Ignored
You may find the button for the selection of varying lots a good idea.

If you have time, please educate us on how to use this simulator or emulator to generate statistics in a spreadsheet as MT4 file.
Attached File(s)
File Type: mq4 VR---STEALS-3-EN.mq4   97 KB | 188 downloads
Practice makes a person perfect
 
 
  • Post #50,776
  • Quote
  • Feb 3, 2022 2:20am Feb 3, 2022 2:20am
  •  greeneye
  • | Joined May 2014 | Status: Member | 42 Posts
hi

is it repaint....?
Attached File(s)
File Type: ex4 dynamic-cycle-explorer-indicator.ex4   43 KB | 146 downloads
 
 
  • Post #50,777
  • Quote
  • Feb 3, 2022 4:17am Feb 3, 2022 4:17am
  •  investo91
  • | Joined Feb 2022 | Status: Member | 15 Posts
hi :

can some one please convert this into MT5 version , please !!
Attached File(s)
File Type: mq4 Weis_Wave_Statistics_1.5.mq4   14 KB | 201 downloads
 
 
  • Post #50,778
  • Quote
  • Feb 3, 2022 5:19am Feb 3, 2022 5:19am
  •  ffss
  • | Joined Jul 2020 | Status: Member | 123 Posts
Hi, could someone fix this compiling errors on these eas? Thanks!
Attached Image (click to enlarge)
Click to Enlarge

Name: Captura.PNG
Size: 9 KB
Attached File(s)
File Type: mq5 MT5-CoupleHedgeEA_v2.6.2.mq5   140 KB | 95 downloads
File Type: mq5 MT5-RingSystemEA_v3.7.2.mq5   157 KB | 88 downloads
 
 
  • Post #50,779
  • Quote
  • Feb 3, 2022 5:37am Feb 3, 2022 5:37am
  •  simnz
  • Joined Nov 2015 | Status: Member | 2,525 Posts
Quoting xxl205
Disliked
{quote} Oh, wow ! That was a quick one. Doesn't look like a decompiled code Well, THANK YOU A LOT ! Now as I'm no coder I'll see what to do with it. This is my manual setup, now a bit cluttered with those colorful arrows and dots, but you get the idea : 1. Wait for a triple setup from the red box END OF TREND indi and the channel-signal. 2. Take the NEXT CANDLE on CLOSE after FIRST ARROW from channel-signal after the RED BOX (countertrending) for some confirmation. 3. More confirmation if FXCorrelator tells you a delta of 50+ (white line)...
Ignored
Gaps in your indicator refers to what?
Practice makes a person perfect
 
 
  • Post #50,780
  • Quote
  • Edited 6:47am Feb 3, 2022 6:19am | Edited 6:47am
  •  xxl205
  • | Joined Aug 2010 | Status: Member | 151 Posts
Quoting simnz
Disliked
{quote} Gaps in your indicator refers to what?
Ignored
Hi ! Please clarify which indicator and which gap

Gaps are at least not ment to be, in any case. The usual chart gap after weekends or daily candle shifts are to be seen as normal, I guess.

If you are speaking of the FXCorrelator indicator at the bottom :

Each currency has its color, red für GBP and green for USD in that case. You see the values also stated at the side. They are sorted from top to bottom, and shift around as to fit.

The white chartline is the DELTA. When for example GBP has +111 and USD has -95, the DELTA is their difference (206 here, commas beside)

Like a temperature difference. -10F to +100F = 110 difference or DELTA so to speak.

The white horizontal lines forming kinda gap are the DELTA values 0 and 50 as you can see at the right side of the chart. Above a trend is most likely, the higher the better.
"We are all just prisoners ... of our own device ..." (Hotel California)
 
 
  • Platform Tech
  • /
  • I will code your EAs and Indicators for no charge
  • Reply to Thread
    • 1 25372538Page 253925402541 3077
    • 1 Page 2539 3077
33 traders viewing now, 1 is a member:
Invisible
  • More
Top of Page
  • Facebook
  • Twitter
About FF
  • Mission
  • Products
  • User Guide
  • Media Kit
  • Blog
  • Contact
FF Products
  • Forums
  • Trades
  • Calendar
  • News
  • Market
  • Brokers
  • Trade Explorer
FF Website
  • Homepage
  • Search
  • Members
  • Report a Bug
Follow FF
  • Facebook
  • Twitter

FF Sister Sites:

  • Metals Mine
  • Energy EXCH
  • Crypto Craft

Forex Factory® is a brand of Fair Economy, Inc.

Terms of Service / ©2023