• Home
  • Forums
  • Trades
  • News
  • Calendar
  • Market
  • Brokers
  • Login
  • Join
  • 5:42pm
Menu
  • Forums
  • Trades
  • News
  • Calendar
  • Market
  • Brokers
  • Login
  • Join
  • 5:42pm
Sister Sites
  • Metals Mine
  • Energy EXCH
  • Crypto Craft

Options

Bookmark Thread

First Page First Unread Last Page Last Post

Print Thread

Similar Threads

How to flow with the order flow? 26 replies

Applying Order Flow & Volume Profiles To Futures Trading 121 replies

Reading Order Flow 19 replies

Order Flow 26 replies

Oanda Order Flow Box 5 replies

  • Trading Discussion
  • /
  • Reply to Thread
  • Subscribe
  • 138
Attachments: Discussions on Order Flow/Volume
Exit Attachments
Tags: Discussions on Order Flow/Volume
Cancel

Discussions on Order Flow/Volume

  • Last Post
  •  
  • 1 2122232425 Page 26
  • 1 232425 Page 26
  •  
  • Post #501
  • Quote
  • Dec 31, 2021 2:18am Dec 31, 2021 2:18am
  •  maverick2017
  • | Joined Jul 2013 | Status: Member | 1,494 Posts
Quoting DonPato
Disliked
{quote} What you so aptly described is very typical of market behavior and as you have noted, it occurs right before the very move you wish to catch. Since you are only watching the DOM and even that has only 5 ticks above and below the last transaction, it is difficult to know if the market might be preparing for a reversal or a continuation...on such a micro level these clues are very hard to find. I would humbly suggest you that using some from of charting might help you "bias" your entries with additional data. So what happens in your description...
Ignored
^^ This will do for me.
Thanks for the time!
A trade should be based on an assumption based on facts
 
 
  • Post #502
  • Quote
  • Edited 9:26am Jan 31, 2022 9:11am | Edited 9:26am
  •  maverick2017
  • | Joined Jul 2013 | Status: Member | 1,494 Posts
I have a question not related to Order flow.

Your previous advice on watching a chart along with level II worked well. Thanks.
A trade should be based on an assumption based on facts
 
 
  • Post #503
  • Quote
  • Edited 4:58am Mar 9, 2022 12:56am | Edited 4:58am
  •  Antth
  • | Joined Jul 2021 | Status: Member | 11 Posts
Attached Image (click to enlarge)
Click to Enlarge

Name: Screen Shot 2565-03-09 at 12.49.28.png
Size: 2.0 MB
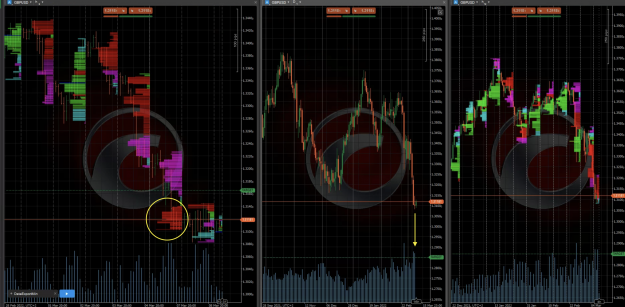
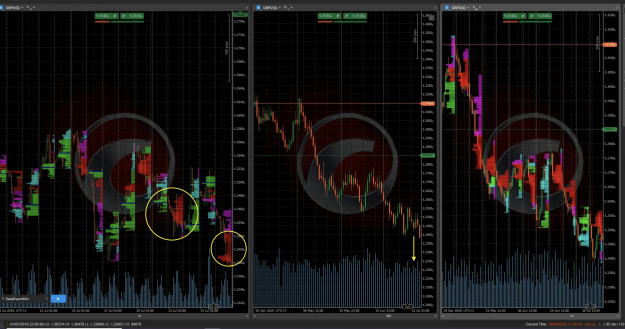
Monday and Yesterday's price on GBPUSD.

Monday has ended with huge selling but price has stalled through out Tuesday.
Tuesday volume (yellow arrow) was also high comparing to its price response.

I am assuming there is an absorption happening.

Edited : Don, I also want to ask about how do you decide if you are wrong or not. I assume that you evaluate your current trade based on development of order flow.
So when you are wrong, do you close your trade before your stop get hit?

Attached Image (click to enlarge)
Click to Enlarge

Name: Screen Shot 2565-03-09 at 16.39.23.png
Size: 2.4 MB

As an example, I attached a hard sell on 23/7/2019. I think this is one kind of absorption? Again, the yellow arrow on the right point to that day's volume.
After that the price continue to go lower quite fast even after 26/7 which is not shown on the chart I attached.

Question is, will you see that you are wrong by looking at order flow between 23/7 and 26/7? What do you see in any graph that might change your mind?
 
 
  • Post #504
  • Quote
  • Mar 9, 2022 4:20am Mar 9, 2022 4:20am
  •  katienotcat
  • | Commercial Member | Joined Jan 2022 | 111 Posts
Pay attention to what specific effect this has on the actual transaction?
 
1
  • Post #505
  • Quote
  • Mar 9, 2022 9:50am Mar 9, 2022 9:50am
  •  DonPato
  • Joined Dec 2015 | Status: Member | 1,509 Posts
Quoting Antth
Disliked
... I am assuming there is an absorption happening...
Ignored
Yes in your screen shot there was some absorption occurring...buying liquidity was stalling the price advance...This may be a clue to future price rise...IF (and this is a BIG IF)...sellers give up. But as you can see, price did NOT rise. It kept pounding away at that buying liquidity, and it was the BUYERS who have up, and price continued to fall.

So this brings me back (once again) to this concept: How does price respond to the order flow? THIS is the key concept. If price is not responding as you think it should then something is wrong.

If I may also take another moment. I have said this before but it just doesn't seem to sink in on this forum. Order flow trading is NOT (I repeat "NOT") some superior form of technical analysis...yet many here seem to approach it from this point of view...you look for "signals"...or "triggers". It just doesn't work that way. You MUST observe the order flow AND ALSO watch how price is responding to it. If you see some heaving selling at the bottom of the day's candle...that is a possible sign of exhaustion...but has price really responded to it yet? In your case NO. Sellers kept pounding away at the buying liquidity until it was all used up or withdrawn. and price dropped again.

You can use these clues to show where the "real" level are for your concept of resistance and/or support. You can bet that on the way back up...this same area will produce some active order flow...and again...how price responds to it will tell you what to expect.

Quoting Antth
Disliked
...Edited : Don, I also want to ask about how do you decide if you are wrong or not...
Ignored
Its not rocket science...I lose. With the way the market has been lately...with the issue with Ukraine...I have been doing a bit of that lately. increased volatility in the markets has caused everyone I know to take a step back and perhaps some time off until this volatility settles down again.
Do more of that which succeeds and less of that which does not - Dennis Gar
 
1
  • Post #506
  • Quote
  • Mar 9, 2022 9:51am Mar 9, 2022 9:51am
  •  DonPato
  • Joined Dec 2015 | Status: Member | 1,509 Posts
Quoting katienotcat
Disliked
Pay attention to what specific effect this has on the actual transaction?
Ignored
This is exactly right...how does price respond?
Do more of that which succeeds and less of that which does not - Dennis Gar
 
 
  • Post #507
  • Quote
  • Apr 5, 2022 12:07am Apr 5, 2022 12:07am
  •  simnz
  • Joined Nov 2015 | Status: Member | 2,525 Posts
Quoting DonPato
Disliked
{quote} Yes in your screenshot there was some absorption occurring...buying liquidity was stalling the price advance...This may be a clue to future price rise...IF (and this is a BIG IF)...sellers give up. But as you can see, the price did NOT rise. It kept pounding away at that buying liquidity, and it was the BUYERS who have up, and price continued to fall. So this brings me back (once again) to this concept: How does price respond to the order flow? THIS is the key concept. If price is not responding as you think it should then something is wrong....
Ignored
I have learned a lot from your posts on the market structure and order flows.

I have developed a semi-automated trading system for risk-averse retirees that generated daily income by trading symbols whose 2-way trading costs are lower than 1 pip or 1 tick or 10 points and are volatile (2% ADR) and mean-reversion tendencies. DAX index is a fit candidate. I am sure the system will benefit from your practical knowledge since trading plans are drawn manually and execution of orders is done by bot or algo.
https://www.forexfactory.com/thread/...verse-retirees
Practice makes a person perfect
 
 
  • Post #508
  • Quote
  • Jan 2, 2023 9:34am Jan 2, 2023 9:34am
  •  Tony358
  • | Joined Jan 2023 | Status: Junior Member | 1 Post
Quoting bhardeman118
Disliked
To be honest order flow is really mitigation and mitigation is just order flow. 99% of people trade completely wrong. This video actually shows how to properly identify order flow and it shows you what order blocks are and how to trade them. in its simplicity, the video actually shows you how to trade like the banks to. I must say this got me started off on the right track. Good luck everyone ! https://www.youtube.com/watch?v=hwiUDKU9wgE&t=9s
Ignored
Just do not buy this guy's course. Their discord group is completely abandoned and you get zero replies and even less support.
 
 
  • Post #509
  • Quote
  • Jul 23, 2023 10:11am Jul 23, 2023 10:11am
  •  ventureinves
  • Joined Mar 2019 | Status: Member | 329 Posts
Order volume is the biggest risk for fx trading !
 
 
  • Post #510
  • Quote
  • Aug 2, 2023 8:11am Aug 2, 2023 8:11am
  •  averied
  • | Joined Aug 2013 | Status: Member | 28 Posts
Few questions for experts in the market..

What's the cheapest way to get real time, 1 minute chart , order flow and volume data from the EURUSD futures market?

Anyone willing to share or Make a group effort to get this data. I'm a programmer, so once I have a data source, I can easily turn this data into a MT4/5 or cTrader indicator

On the theoretical side, the main concern I have with orderflow is that pending orders are mostly cancelled, so It gives a false sense of where liquidity is. Do the futures market offer detailed volume data specifying how many contracts where actually bought and sold on each minute?

I think as Forex traders we are límited with tick volume data, so having futures volume combined could be interesting in order to design new strategies and systems
 
 
  • Post #511
  • Quote
  • Aug 2, 2023 9:02am Aug 2, 2023 9:02am
  •  pooh123
  • Joined Jul 2012 | Status: Member | 785 Posts
@averied Option 1) Check out https://clusterdelta.com/. They process futures order flow data and display it with MT4/MT5 indicators. The cost is less than $10/month with premium package.
Option 2) Check out https://www.sierrachart.com/. This is what I've been using. Cost for standard package including data feed is around $30/month.

"Do the futures market offer detailed volume data specifying how many contracts where actually bought and sold on each minute?" Yes. They do.
 
 
  • Post #512
  • Quote
  • Sep 10, 2023 4:51am Sep 10, 2023 4:51am
  •  scherzi
  • Joined Aug 2013 | Status: Member | 614 Posts
Quoting DonPato
Disliked
{quote} The idea of MM (market makers) or (Market manipulators) is a "red herring" IMHO. While I'm sure it does happen (read central banks, or US FED) to say that some malevalent entity out there is manipulating a literal trillion (with a "t") dollar a day market to find your 5 mini lots is just ridiculous on its face. The amount of "liquidity" or deep pockets it would take to move the market even 1 tick is staggering let alone "hunt" your stop.
Ignored
The market maker is the market. I mean, someone that owns a set of computer programs and equipment that creates a digital market. One of the features of that software is pricing assets. Then pepople come in and interact with that software creating the market, ie, CFD providers, stock markets, futures markets, interbank market, etc...

The owner of that virtual market could potentially manipulate the price, just like the owner of a fruit store sets the prices they want for potatoes and peaches. The pricing algorithms that are needed for any digital market to work do it all the time in fact, otherwise prices would remain static.

Secondly, you do not need to forecast where liquidity is. First, because you know where it is as the market is yours and you can se the open interest and the order exectutions. Then, you can merely set different models like: "Operate with a 50-point spread, then expand to 60, then to 70, then to 80. Afterward, move the price 120 points down and 240 points up or 80 + 40 * 1.62 points up. Finally, move the price to the midpoint of the initial spread plus 2 points". So you would see highs and lows being taken consecutively and the fibonacci levels would appear due to the simmetry of the algorithm moves.

Ultimately, you know that liquidity is simply beyond the areas not been traded yet, because the areas traded are, obviously traded, and nothing remains there therefore. So, you only have to attack the highs and the lows. For instance:

Attached Image (click to enlarge)
Click to Enlarge

Name: screenshot.png
Size: 10 KB
 
 
  • Post #513
  • Quote
  • Sep 10, 2023 7:45am Sep 10, 2023 7:45am
  •  scherzi
  • Joined Aug 2013 | Status: Member | 614 Posts
Quoting DonPato
Disliked
OK...lets review: "The Market" is simply a computer that matches orders, buys with sells, aggressive with passive when two parties agree upon a price to transact. For everyone that wishes to interact with "the market" you must do so by placing orders via a broker or a bank No order will be accepted until it has BOTH a price and size (volume) There are literally thousands of orders coming into the market every second of every minute during the session of any given market This "flow" of orders and their respective volumes are matched together and...
Ignored
Hi, maybe it could also be considered that is not the surplus but the algorithms the markets are programmed with that move prices.

Surplus may be a trigger, but also arbitrage, for instance, where the main target is not allocating orders but getting a quick small profit.

Regarding the above, you can verify that there is not such inefficiency in markets such as CFDs or Crypto (you can extract via API bid and ask prices of any traded asset from Binance and similar platforms and verify that no one is ever selling below the ask, it is completely manipulated). The conclusion here is that the algorithm that is princing these assets is not allowing you to trade (market orders) directly against other traders. This implies that it is the market that is moving prices, not traders. And the owner of that computer (allow me this simplification) can tweak it at his own will.
 
 
  • Post #514
  • Quote
  • Sep 10, 2023 8:03am Sep 10, 2023 8:03am
  •  scherzi
  • Joined Aug 2013 | Status: Member | 614 Posts
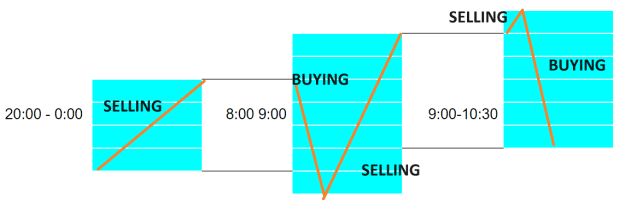
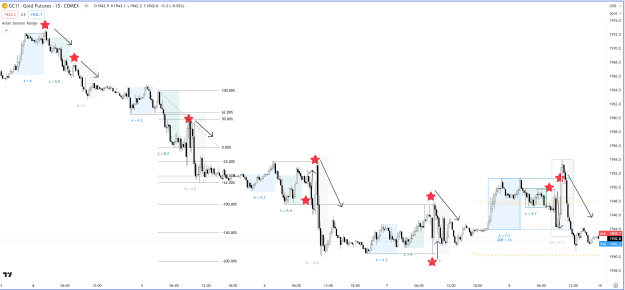
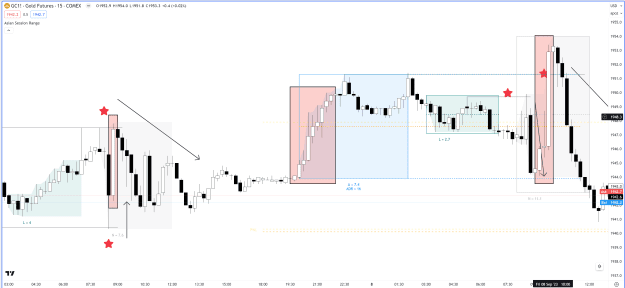
Regarding the structure, orderflow and volume or open interest. There are different ways to explain it. But the trading sessions (Europe/Americas/Asia) leave above and below them a lot of liquidity. Also the 50 % of the range they create define a potential separation between cheap (low) and expensive (high) prices within.

See this chart highlighting the trading sessions and where prices interact with previous sessions to take or draw on liquidity:


Attached Image (click to enlarge)
Click to Enlarge

Name: screenshot.png
Size: 93 KB


The most obvious pattern (there are a few of them) is when prices break above or below old resistances or supports to grab the orders liying beyond them and then moves in the opposite direction. These type of events occur every day and I think they are worth studying them.

Finally, as it is really hard to get to understand which breaks are reversals and which ones are not, one maybe has to think: "did price have a reason to come into this level or not?". And if price had a reason, if a market objective is completed, maybe there are chances for a reversal as long as the main structure is following that direction the price is supposed to reverse to.
 
 
  • Post #515
  • Quote
  • Sep 10, 2023 8:14am Sep 10, 2023 8:14am
  •  scherzi
  • Joined Aug 2013 | Status: Member | 614 Posts
And another final post for now. More about market structure and orderflow. Think in a candlestick and the hours, days of the month, months in a year or 6 years that have more volatiliy (candle size).

Which is the typical shape of these long candles? Think about it. How do they start? How do they begin to form? how do they expand? How do they create the high and the low? how do they close?

Consider in this screenshot price going in one direction as one single candle no matter how of them are required to build it due to the TF.
Attached Image (click to enlarge)
Click to Enlarge

Name: screenshot.png
Size: 75 KB

Can you see how the pricing algo works by watching how it creates the impulses that last N candles?
Attached Image


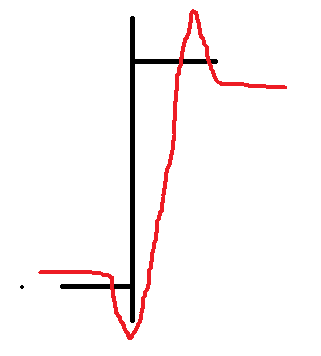
Open, down, up and a small retracement for closing. That is how impulse candles work, more often that not, no matter the timeframe you consider.

Finally, I have to leave, it is easy to spot if markets are bearish or bullish without any indicator other than a line or candlestick chart

Attached Image (click to enlarge)
Click to Enlarge

Name: screenshot.png
Size: 7 KB
 
 
  • Post #516
  • Quote
  • Sep 12, 2023 3:56am Sep 12, 2023 3:56am
  •  Pincharol
  • | Joined Jan 2020 | Status: Junior Member | 2 Posts
Dear Don,
I hope you're well. Some time ago I stumpled upon your thread about order flow on ff.
I really do think that orderflow and volume will provide me the basics of understanding the market behaviour. I hope you'll find time to write me back and explain your point of view on following topic:
At the moment I am trying to find out which insights can be drawn out from the fixed range volume profile indicator on trading view.
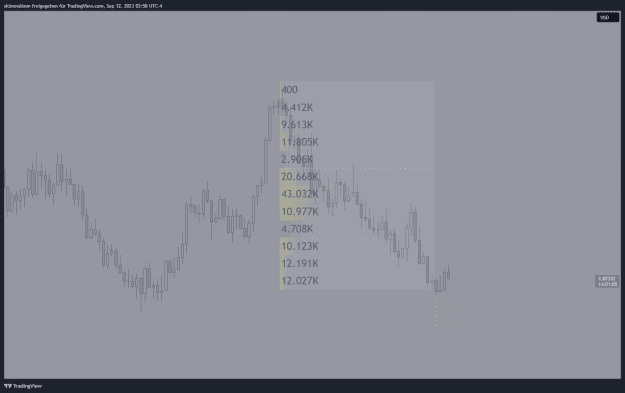
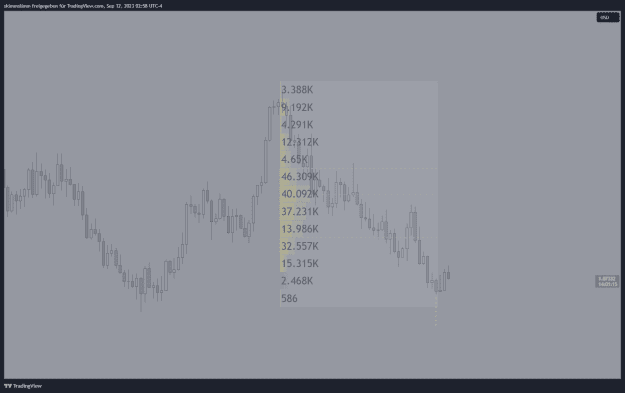
On the daily TF I am investigating how the delta tick volume is changing stepwise from candle to candle. I've been expecting that the data on the volume indicator changes only in price segment of the last candle which it does, most of the time. But again and again I state, that one particular candle ( I assume the candle which is breaking a certain structure) changes not only the data in the segment of the actual candle but furthermore the complete structure.
Why? How can the tick volume change beyond the actual market price? Could it be, that in course of take profiting or activating the stoplosses the initial orders are closing this way and dissapearing from the market?
How would you interpret the attached example? I would very much appreciate your answer.
Thank you
Attached Image(s) (click to enlarge)
Click to Enlarge

Name: EURUSD_2023-09-12_08-58-57_1abfb.png
Size: 17 KB
Click to Enlarge

Name: EURUSD_2023-09-12_08-58-46_71056.png
Size: 17 KB
 
 
  • Post #517
  • Quote
  • Sep 12, 2023 5:18am Sep 12, 2023 5:18am
  •  jinefune
  • | Membership Denied | Joined Sep 2023 | 1 Post
I said you need all 3 things 1PA 2volume 3deltas but I would include a few more things. Context is everything. Without context (PA and others) orderflow will trip you up as it gets manipulated in certain insto areas.
 
 
  • Post #518
  • Quote
  • Last Post: Nov 15, 2023 6:43am Nov 15, 2023 6:43am
  •  Snowman95
  • | New Member | Status: Junior Member | 1 Post
Quoting RickM
Disliked
Hi Don One of the things I study every night on my Motive Wave order flow charts is the battle between passive limit orders and aggressive market orders. I see two conditions which I believe need to be traded in two separate methods. Without doubt, buyers don’t create bullish markets and sellers don’t create bearish markets because that’s not what allows the market to move. The passive limit orders sitting on a chart I believe are only to allow movement in one direction to encourage a reaction from traders. I see the real direction is caused by...
Ignored
Hi, I would like to try out your strategy that you mentioned above. Do you still use it? How you determine SL levels? Thanks for your reply.
 
 
  • Trading Discussion
  • /
  • Discussions on Order Flow/Volume
  • Reply to Thread
    • 1 2122232425 Page 26
    • 1 232425 Page 26
2 traders viewing now
Top of Page
  • Facebook
  • X
About FF
  • Mission
  • Products
  • User Guide
  • Media Kit
  • Blog
  • Contact
FF Products
  • Forums
  • Trades
  • Calendar
  • News
  • Market
  • Brokers
  • Trade Explorer
FF Website
  • Homepage
  • Search
  • Members
  • Report a Bug
Follow FF
  • Facebook
  • X

FF Sister Sites:

  • Metals Mine
  • Energy EXCH
  • Crypto Craft

Forex Factory® is a brand of Fair Economy, Inc.

Terms of Service / ©2023