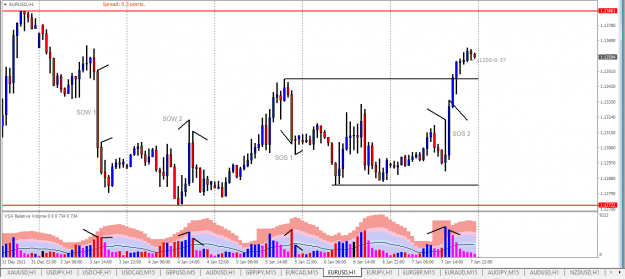
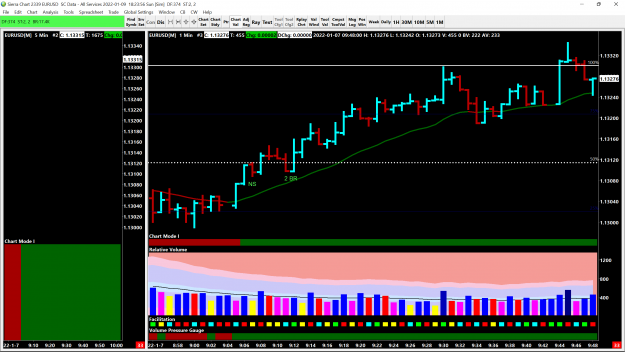
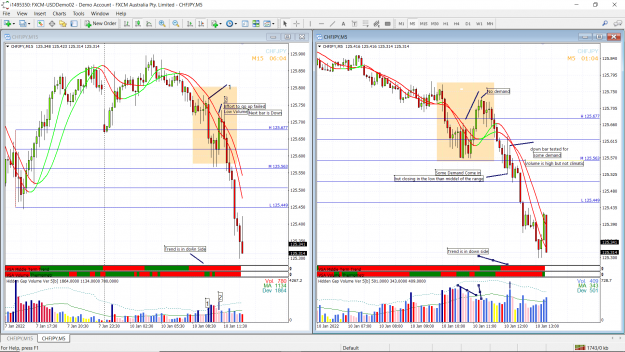
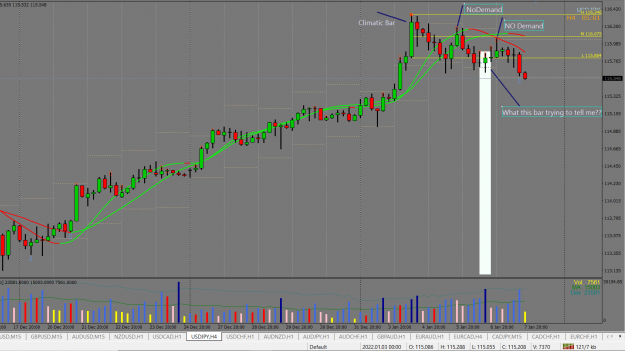
And on this chart price is making no Demand bars in range of 50% of climatic bar.
but
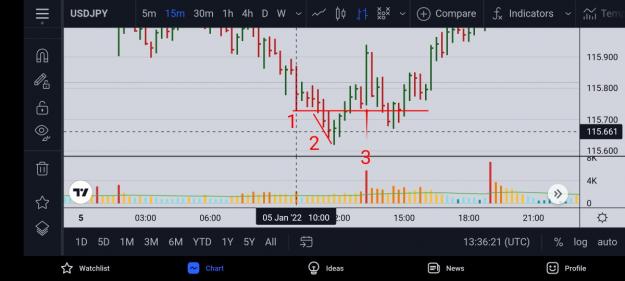
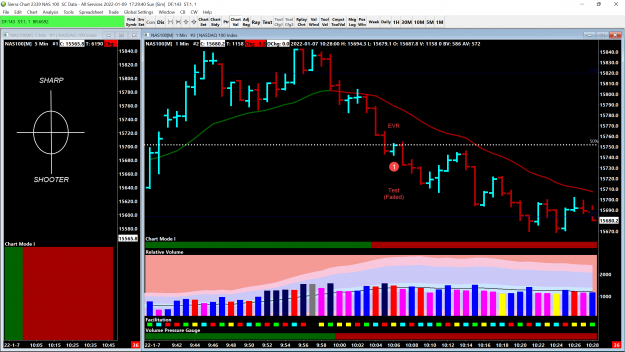
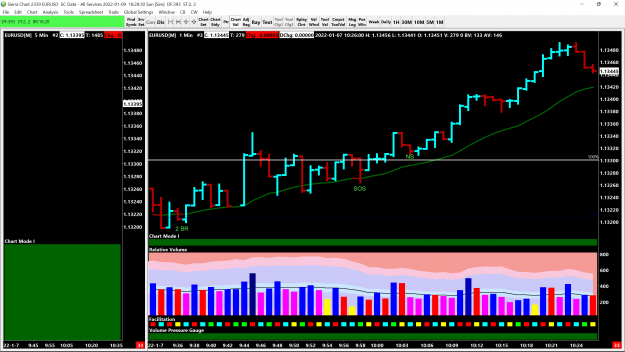
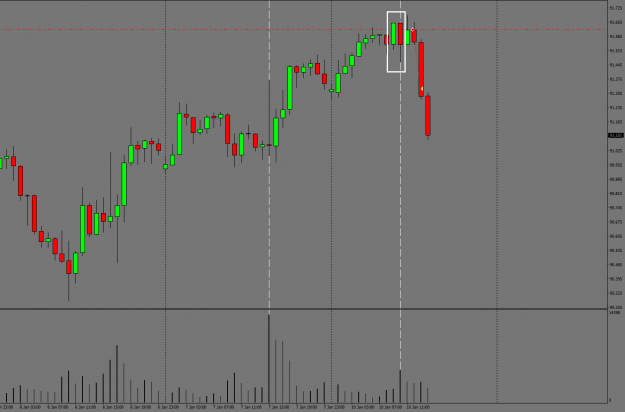
what that highlighted bar trying to tell me. I know when weakness appears it appears on up bars, but the volume of that bar (highlighted bar) is far more than a climatic bar.
but
what that highlighted bar trying to tell me. I know when weakness appears it appears on up bars, but the volume of that bar (highlighted bar) is far more than a climatic bar.
Attached Image (click to enlarge)
Learning is a never ending Journey
1