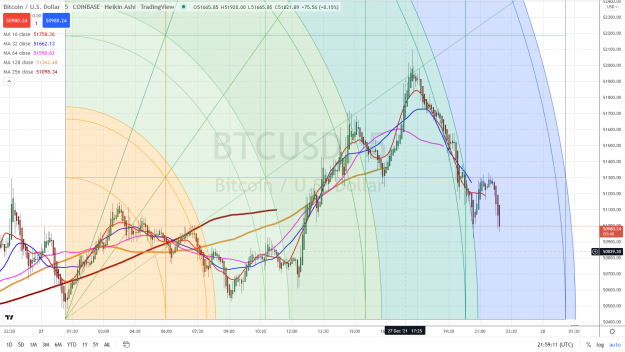
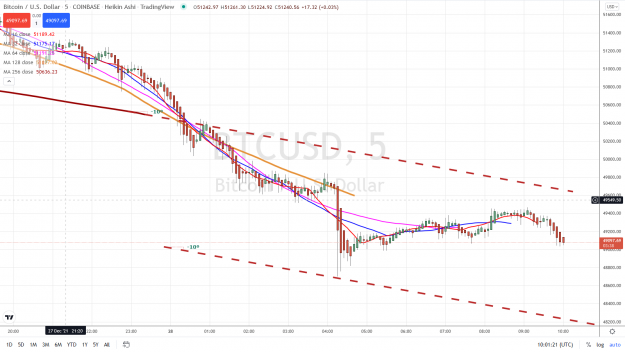
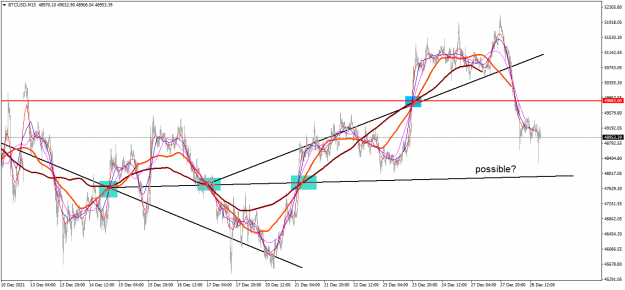
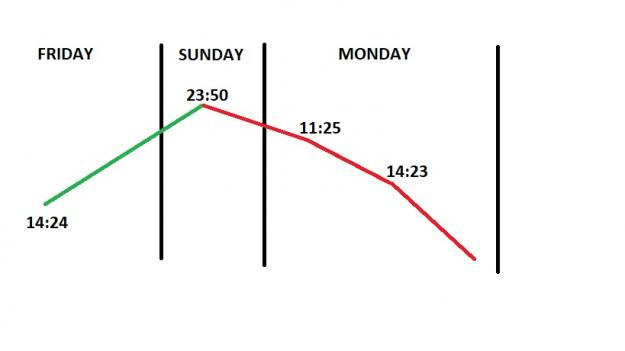
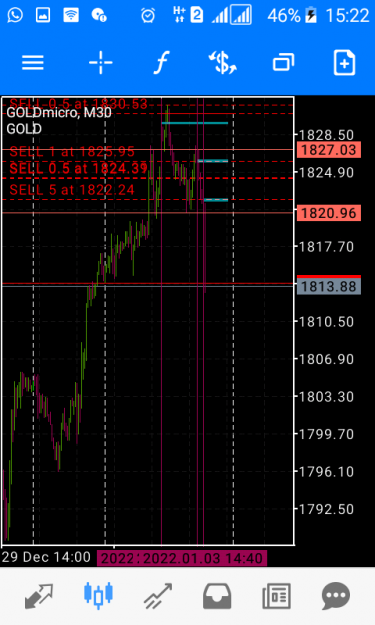
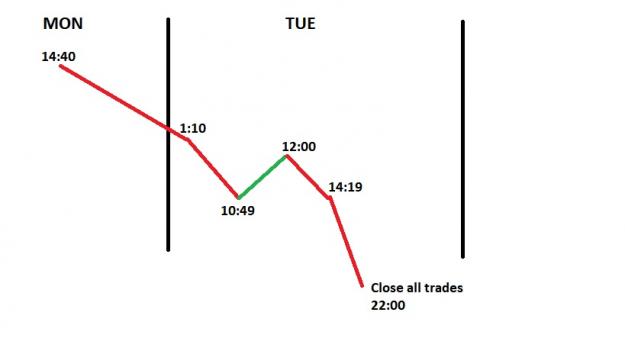
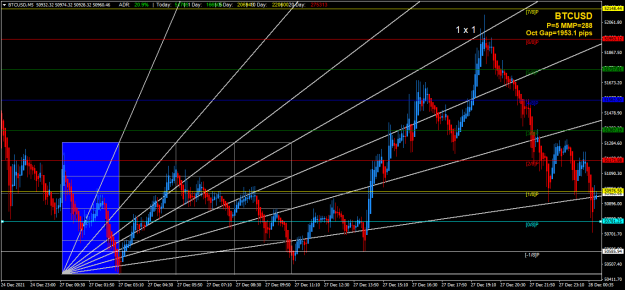
Because of the 24/7 trading environment, I am finding grid measurements for Bitcoin in particular to be very accurate. Needs more testing, but the example below pretty much says it all....that last move up on Bitcoin stopped at a key area premeasured from a previous significant impulse wave. One of the hardest things to take into consideration when measuring grids is the Friday to Sunday market close, or the daily Futures Market activity that opens during the NY session, all of which has an influence on currency prices....not so with Bitcoin....so the probability of accurate measurements is there....note of greatest interest the 1 x 1
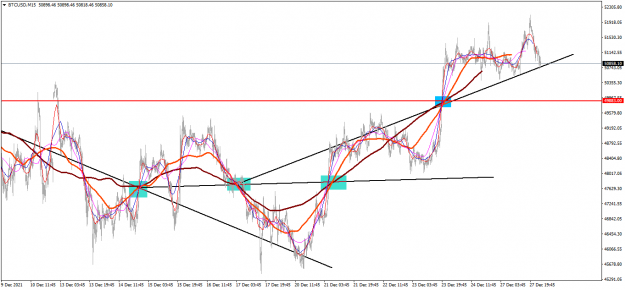
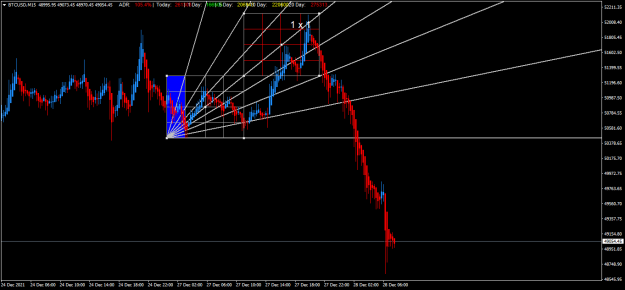
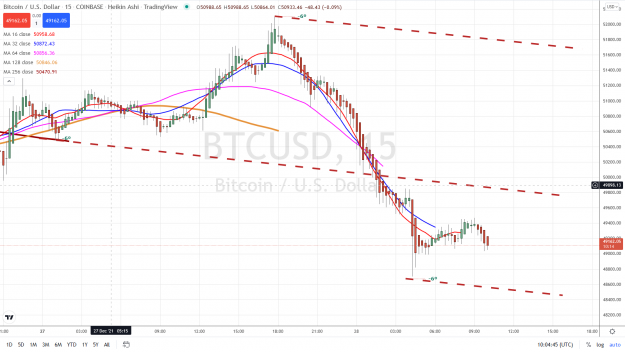
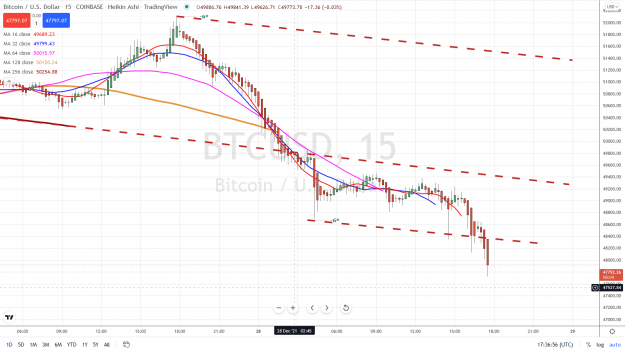
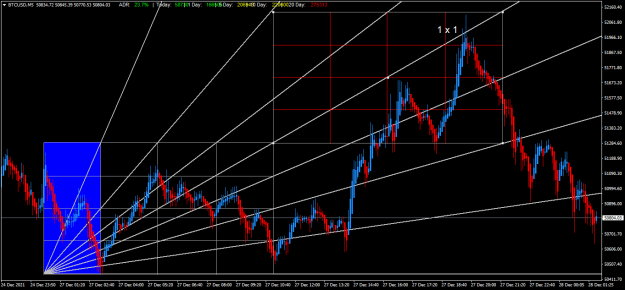
edit....note the principal of doubling the grid on the second chart....
edit....note the principal of doubling the grid on the second chart....
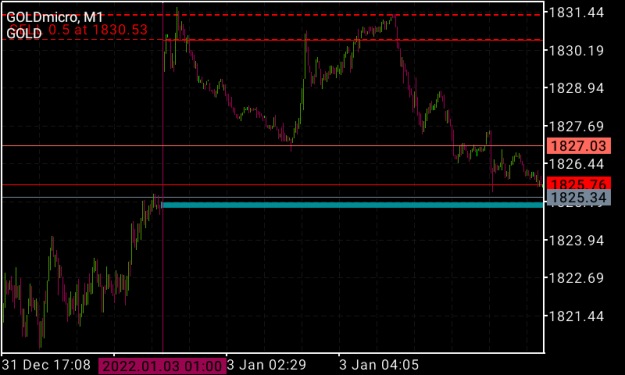
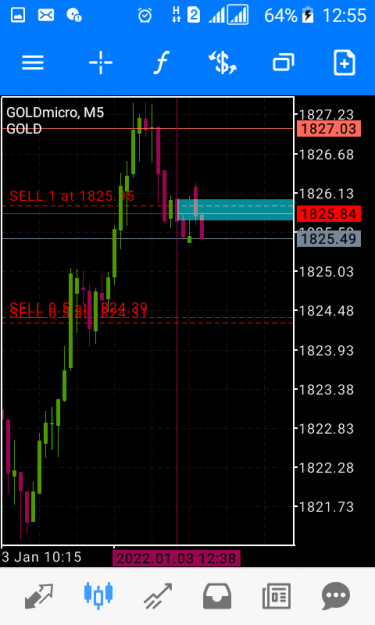
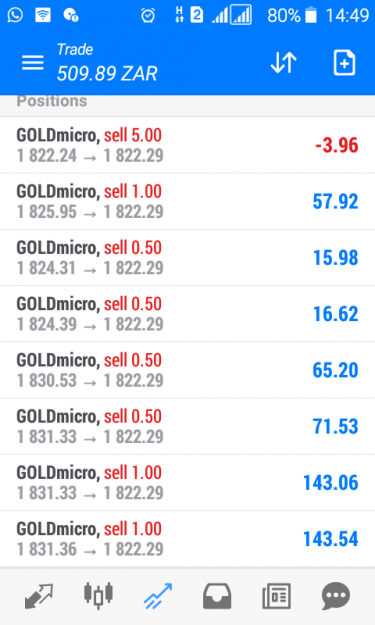
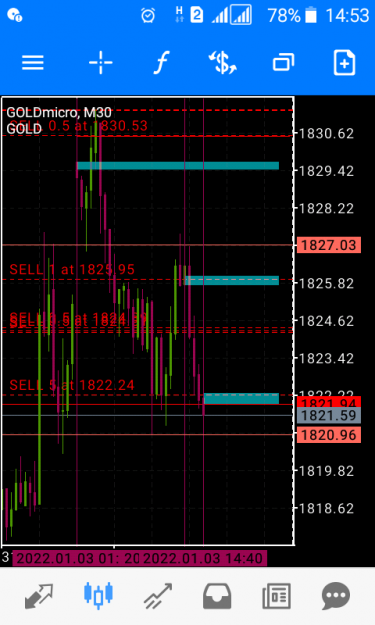
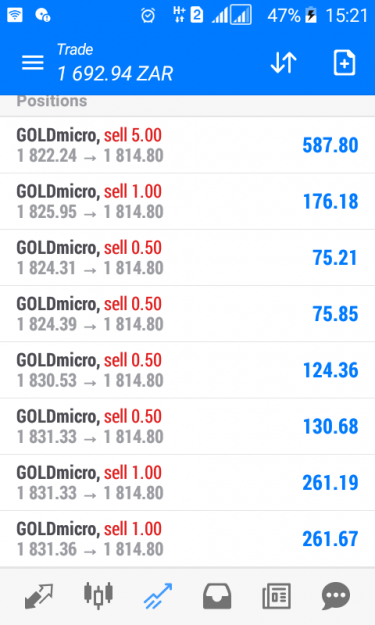
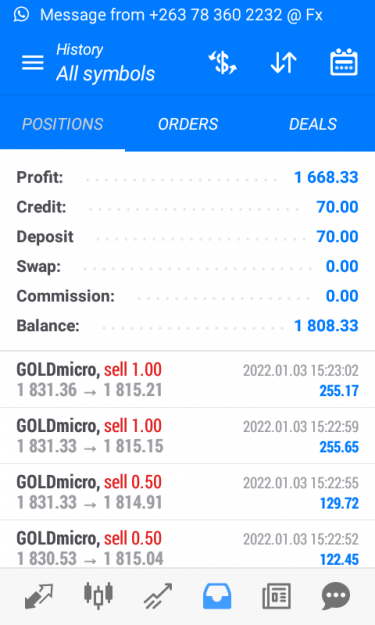
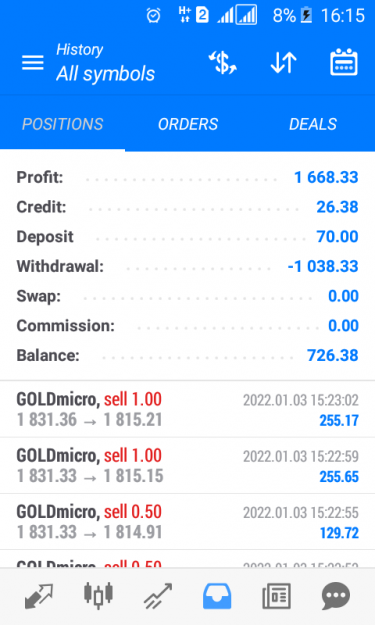
Attached Image(s) (click to enlarge)
3