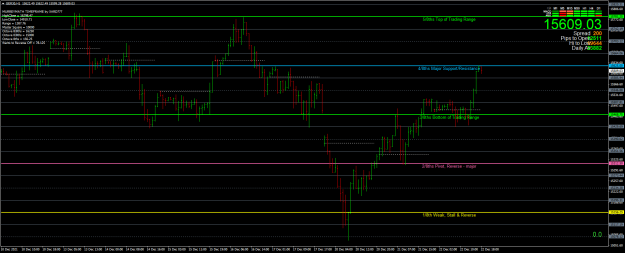
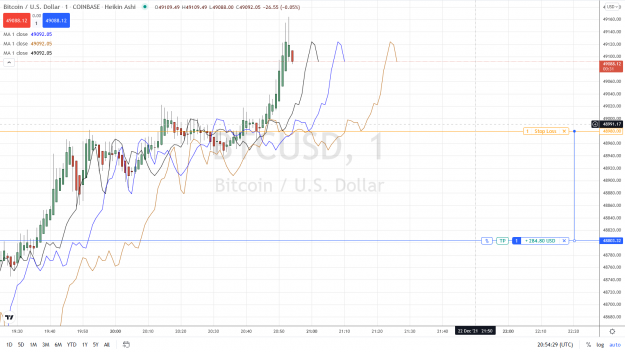
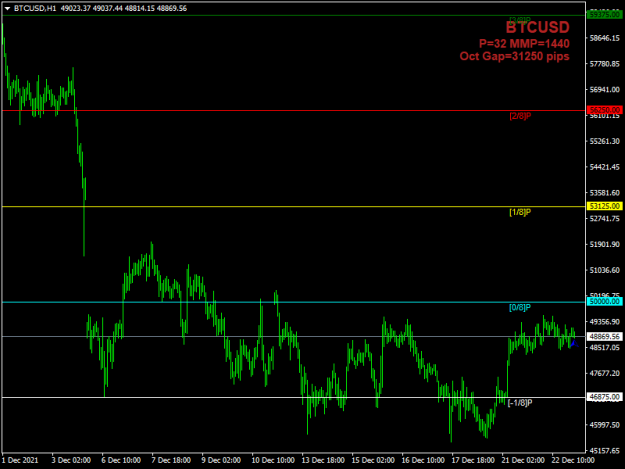
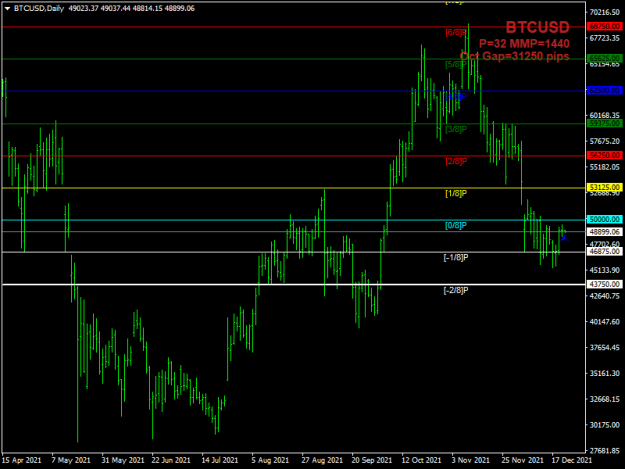
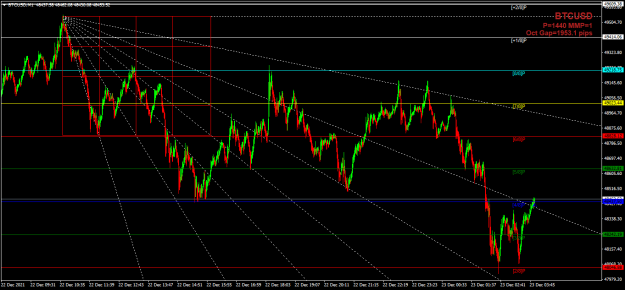
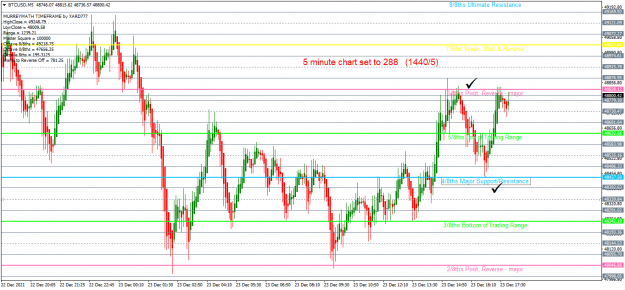
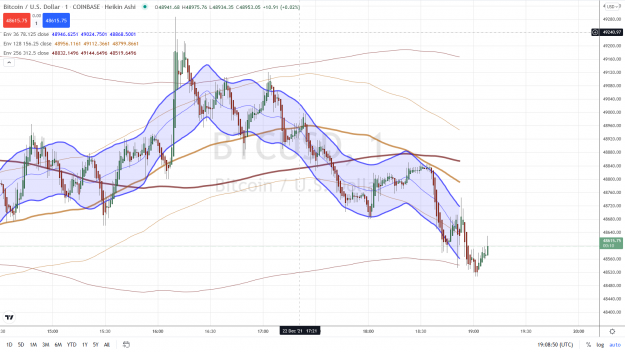
Well when writing above post Price Action broke CMA 256 on the downside. Closed Long position Profit 999 $ {image} {image}
Ignored
Thank you for posting informative analysis, and sharing wisdom, very much apprecaited.
If you don't mind a quick question. Do you trade coin? Or futures? Broker? From what I've gathered, with limited knowledge of course, commissions are quite high in and out of coin? Please advise, thank you in advance.
{quote} Thanks Swede That looks interesting 768, 60min bars are 32 days so a Daily set to 32 days would be of interest ps or maybe a 16day cycle 384 x 60min = 16days Just fractals at work
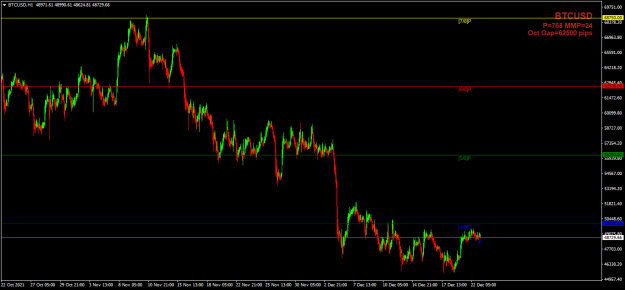
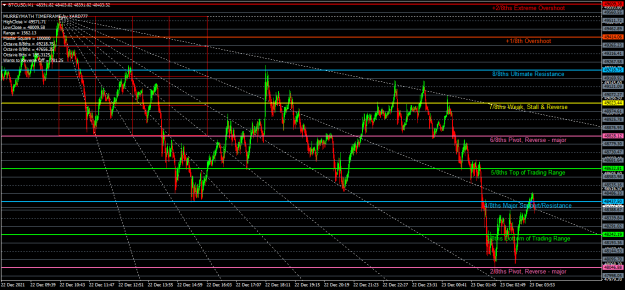
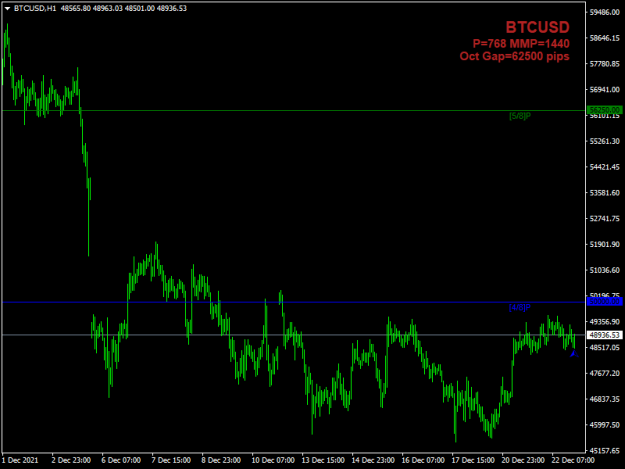
{quote} Swede Your 1st chart is wrong for one hour at 32 days it should be mm 768 If you wanted to see 1 day as a 60 min you should set MM 24 on a 60min chart of course it is fun to see a 1 min with a MM 1440
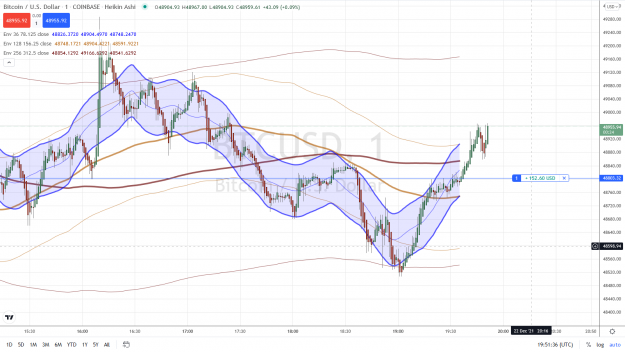
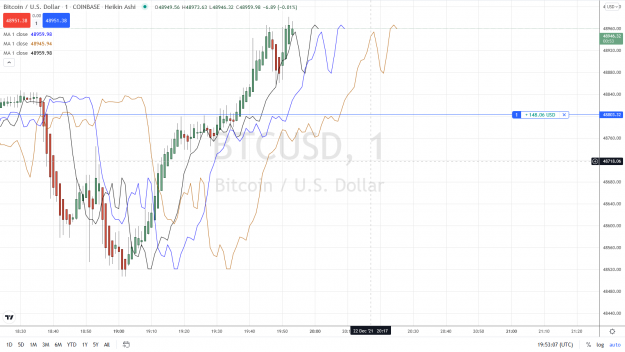
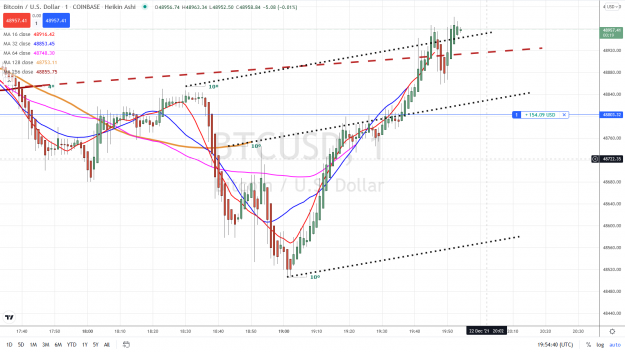
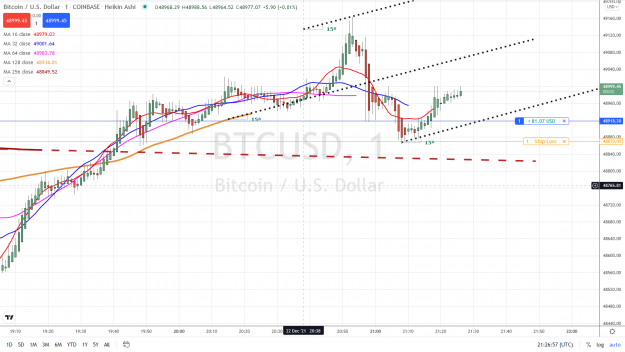
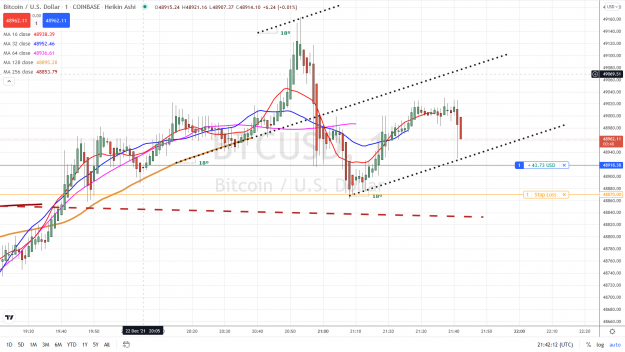
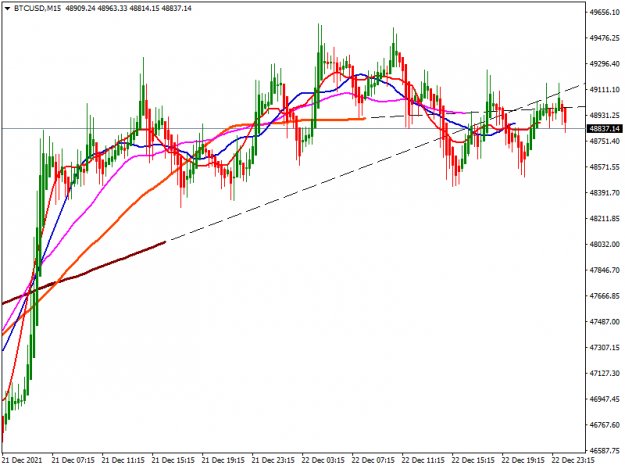
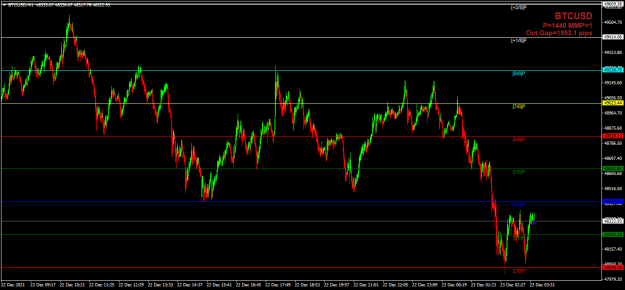
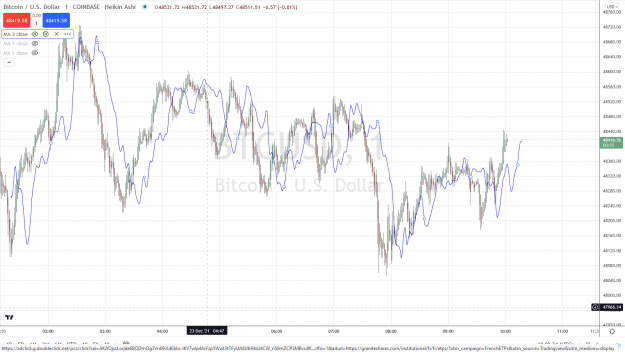
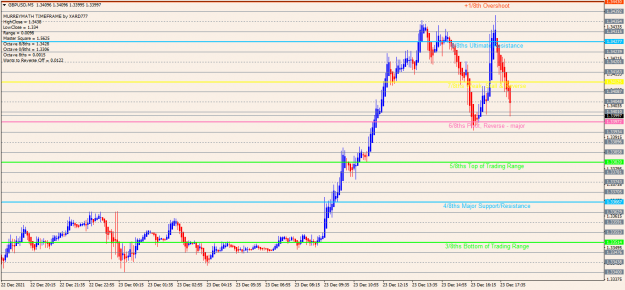
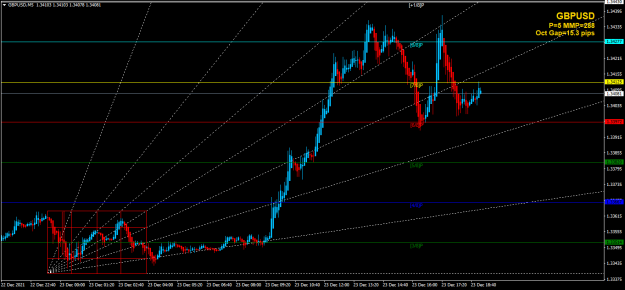
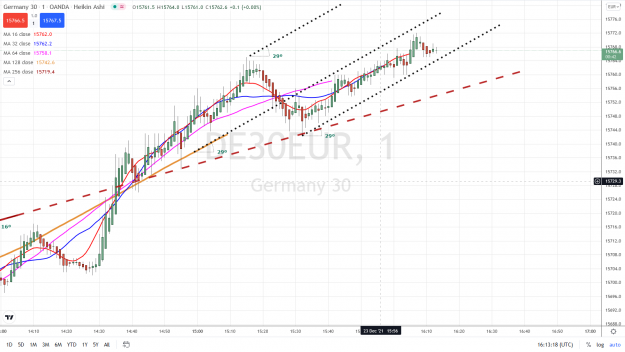
{quote} I hope not Chart shows both MM on same chart The one you use you have to enter both the mm value and Timeframe your looking at The one I use you just enter the MM value no matter what chart you are looking at ps mine default 64 just change that number to 768 when you are looking as a 60 min chart {image} {image} {image}
Ignored
Way more user friendly, like the 1/4 and 1/2 between significant levels....if one has a strong connection and is alert one can do some scalping damage imho