• Home
  • Forums
  • Trades
  • News
  • Calendar
  • Market
  • Brokers
  • Login
  • Join
  • User/Email: Password:
  • 11:31pm
Menu
  • Forums
  • Trades
  • News
  • Calendar
  • Market
  • Brokers
  • Login
  • Join
  • 11:31pm
Sister Sites
  • Metals Mine
  • Energy EXCH
  • Crypto Craft

Options

Bookmark Thread

First Page First Unread Last Page Last Post

Print Thread

Similar Threads

The Not So Perfect but Perfect System 13 replies

The perfect trading system 1,207 replies

Everything to Nothing to get Everything? 7 replies

The perfect trading system 3 replies

Survey on The Perfect System 7 replies

  • Commercial Content
  • /
  • Reply to Thread
  • Subscribe
  • 76
Attachments: Trading With Extremely Good Edges
Exit Attachments
Tags: Trading With Extremely Good Edges
Cancel

Trading With Extremely Good Edges

  • Post #1
  • Quote
  • First Post: Edited Jun 9, 2022 5:13am Oct 23, 2021 10:05am | Edited Jun 9, 2022 5:13am
  •  FX-Mike
  • | Commercial Member | Joined Apr 2017 | 395 Posts
Hello traders,

the goal for this thread is to teach my community members (and everyone else who is interested) my view on the markets and the best trading edges that I found during the years.

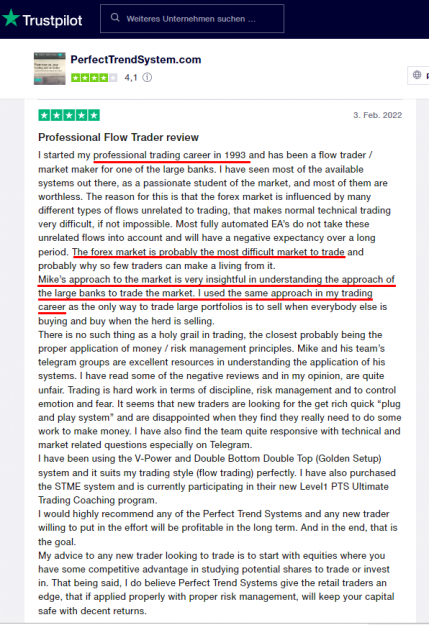
My name is Mike Semlitsch. I'm the owner of the website www.PerfectTrendSystem.com and I trade forex as well as commodities since 2007. Since then I spent 30,000+ hours analyzing the markets, finding trading edges and teaching other traders my view on the markets.

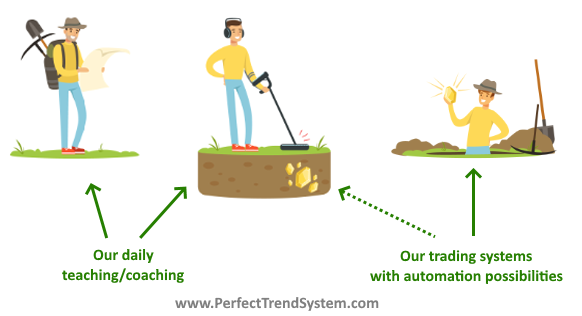
During the past years I have built a strong trading community with thousands of traders around the website and within our telegram groups. Our community is trading very actively trading with 3 of my trading systems. Our coaches and experienced members are helping new traders every day.

Because my biggest goal is to help other traders, I'm especially proud that 6 of our members are now prop traders besides their day jobs at FTMO (because our systems can be automated) who are managing money from investors.

E.g. our member Jeff is managing a 6-digit real-money account and gets his profit share every month: Member Jeff got a prop trader

Before I start sharing my knowledge I want to proof that I’m able to make money with trading. Therefore, maybe one thing or another that I will post here about trading could make sense.

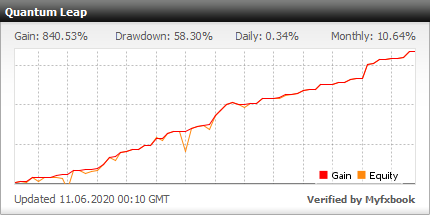
Here you can see the verified results of a real money that I traded live in front hundreds of my community members during 1 year:

https://www.myfxbook.com/members/PTS...m-leap/4186285

Attached Image


Here you can see the verified results of a real money that I traded during the past year where I used new edges which my community members do not know at the moment (but I will share them here):

https://www.myfxbook.com/members/PTS...level2/8982509

Attached Image


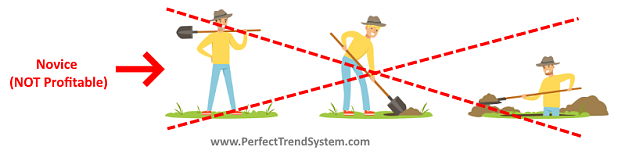
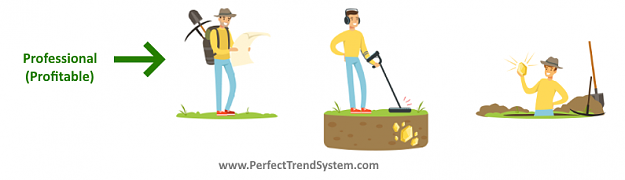
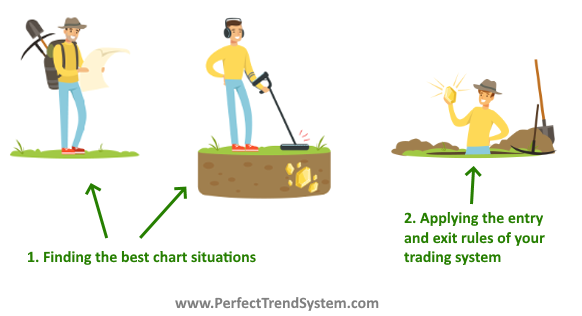
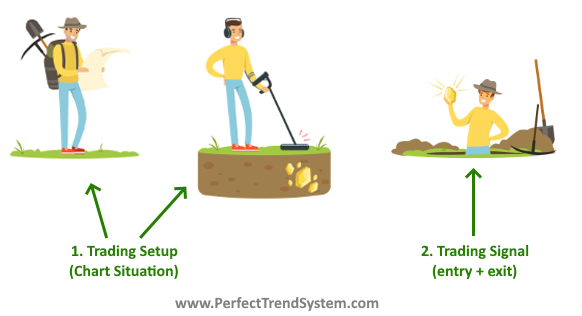
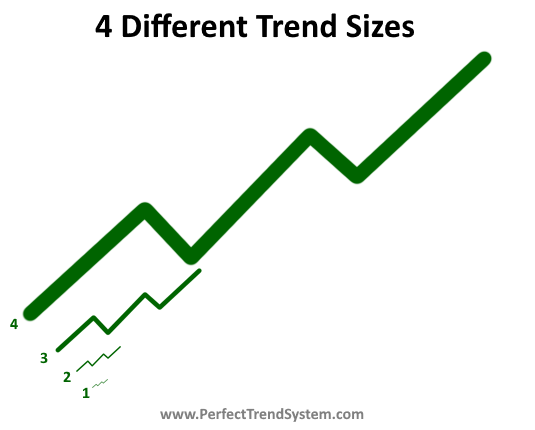
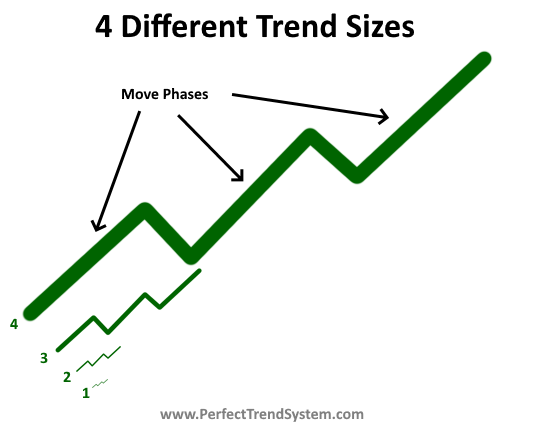
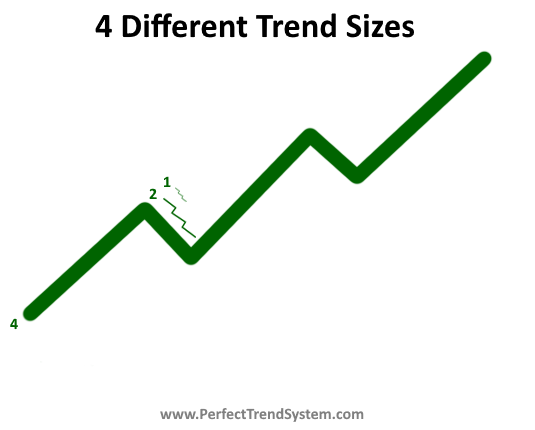
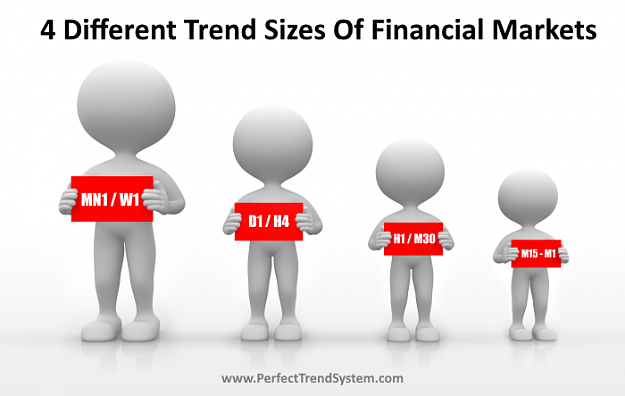
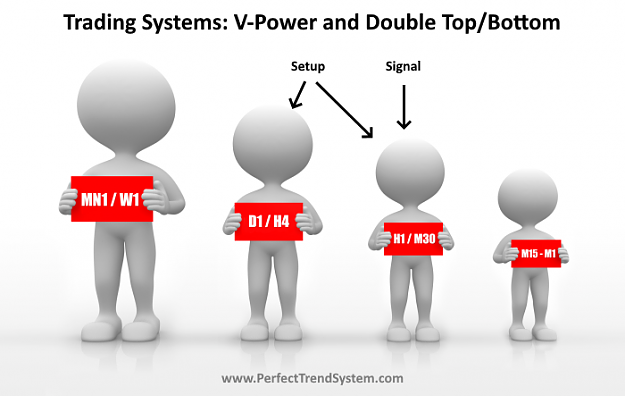
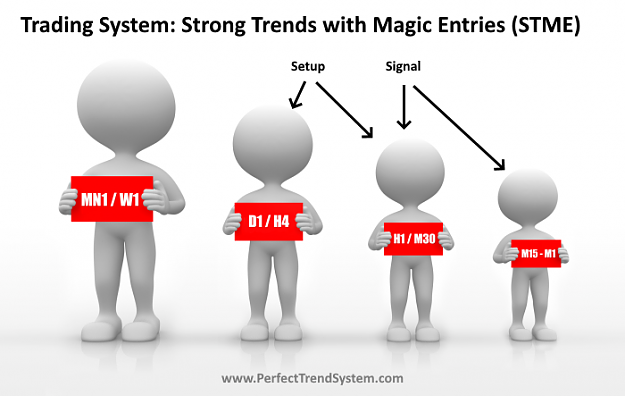
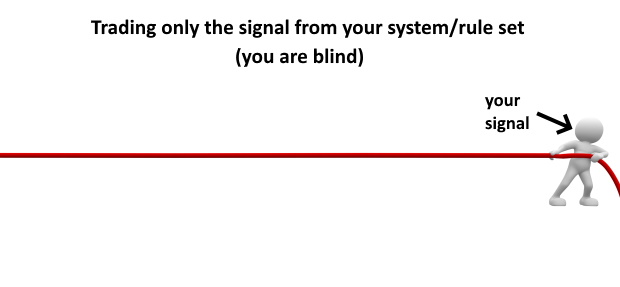
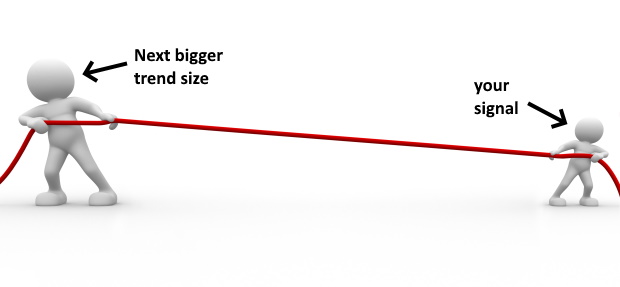
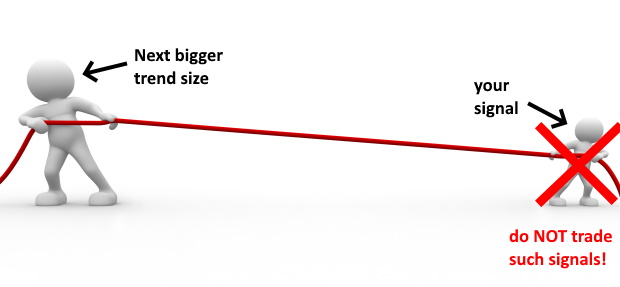
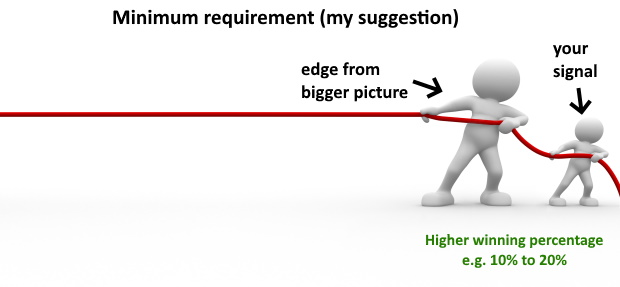
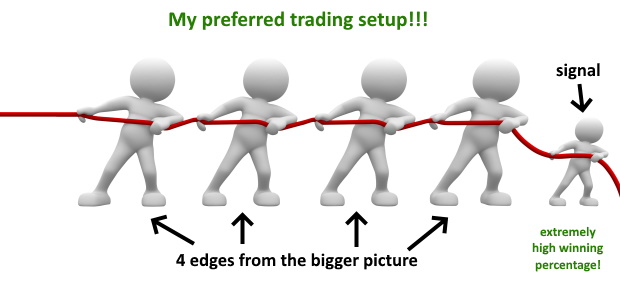
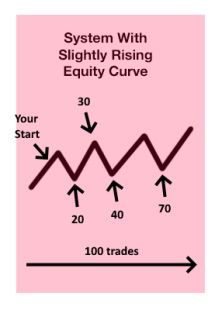
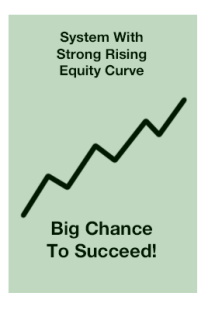
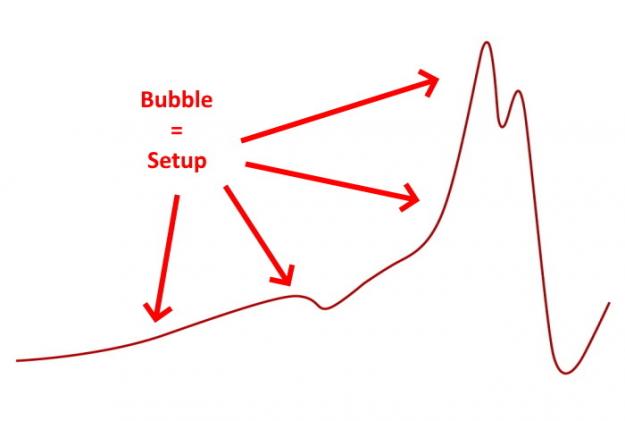
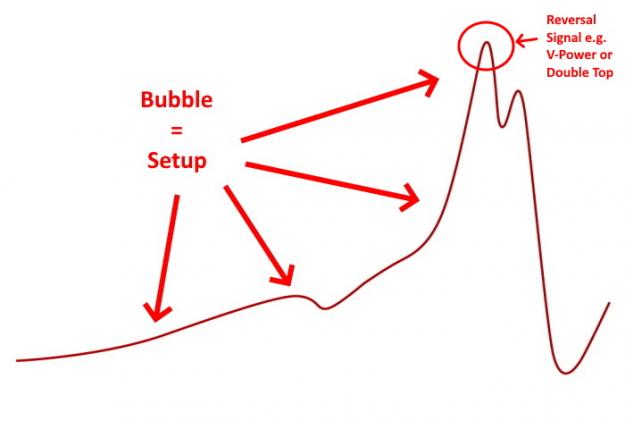
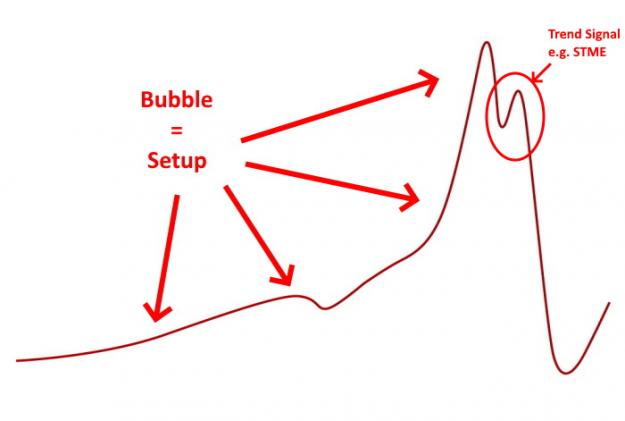
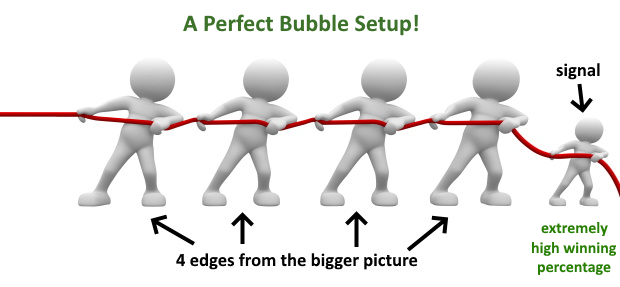
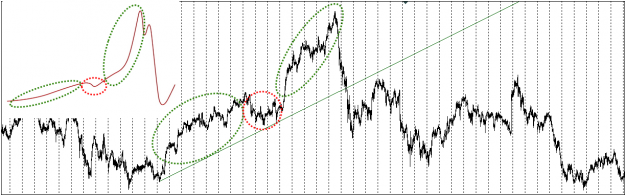
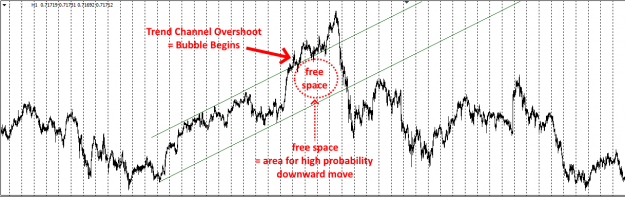
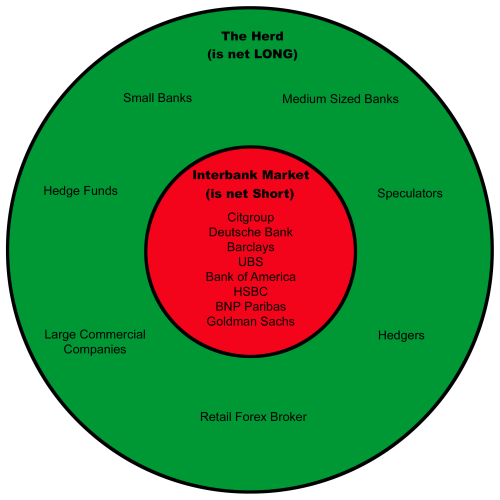
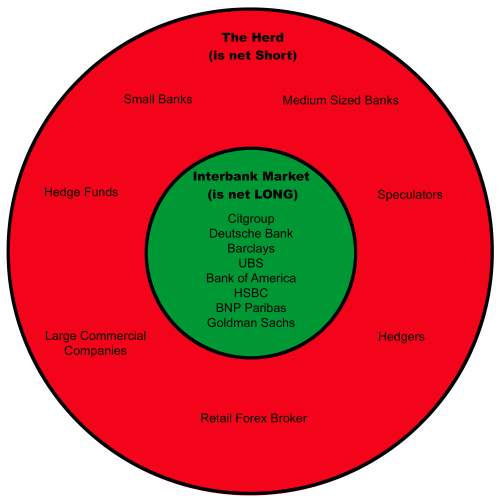
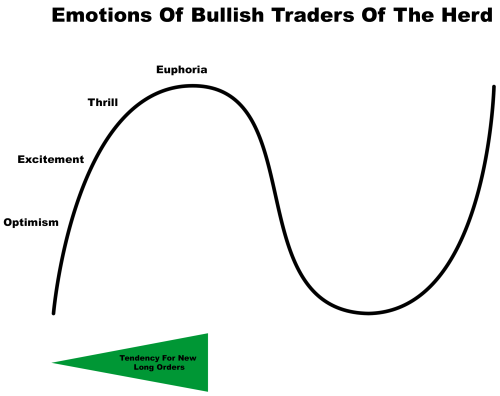
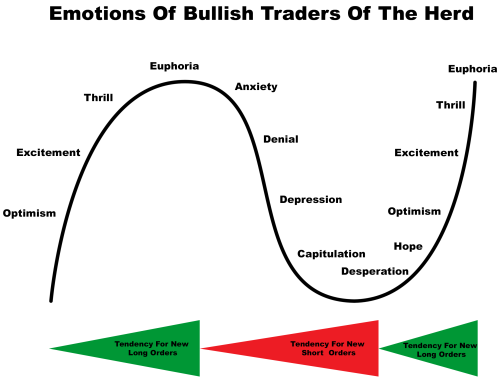
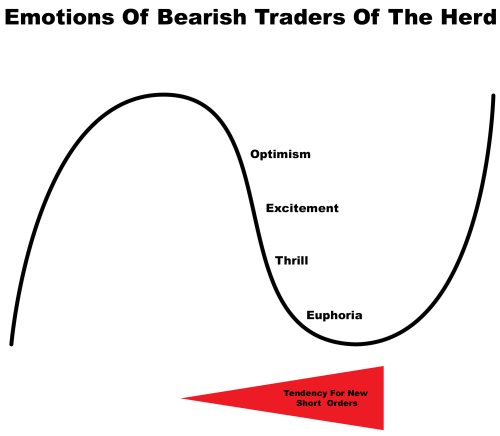
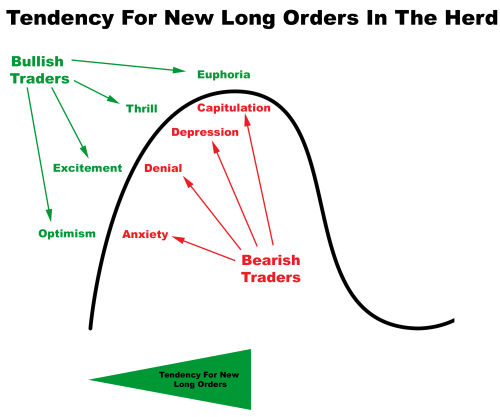
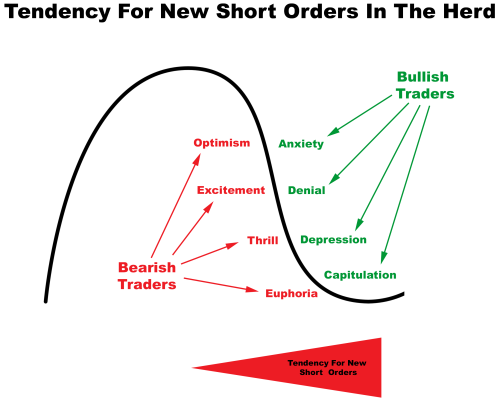
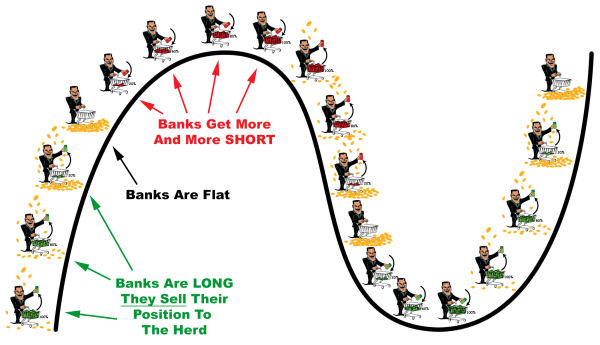
I will now explain my trading philosophy and what I learned about trading in a very visual manner. I will use analogies to make the explanations even more "tangible".

If you are not yet a profitable trader, then I'm sure that the following explanations can guide you into the correct direction.
  • Post #2
  • Quote
  • Oct 23, 2021 10:17am Oct 23, 2021 10:17am
  •  FX-Mike
  • | Commercial Member | Joined Apr 2017 | 395 Posts
1. Be like a professional Gold Hunter

As a trader you should see yourself as a business man. As a trader you also have costs (commissions, losing trades, time and stress) and your trading activities should bring enough money to compensate these costs (and preferable much more). Otherwise it makes no sense for you to trade at all, at least from the financial side.

One type of a business is quite comparable to being a trader: A Gold Hunting Business

Did you watch the Netflix series “Aussie Gold Hunters”? If not, then maybe you should watch a few episodes to see the struggles of a professional gold hunter to get profitable at the end of the year.

In that series a camera team accompanied different teams of gold hunters and recorded their daily routines.

The gold hunting technique/approach of each of the teams was totally different.

One team had built a huge sift-machine which cost 1+ million dollars, they used excavators and they employed a lot of staff members. This team had the highest fixed costs of all teams and therefore needed to find the biggest amount of gold to get into the profit zone:

Attached Image


Another team (a man and his wife) used less expensive equipment. They used 1 excavator and a small sift-machine. This team had still a lot of fixed costs but much less than the big team above:

Attached Image


The third team used the least amount of equipment. They mainly used metal detecting devices. This team had the least amount of fixed costs and therefore they needed to find the least amount of gold to get into the profit zone compared to the other two teams:

Attached Image


Although all gold hunting teams had a different technique/approach they all had to fight with the same problem.

Problem: The resources (equipment, staff, money, time) were limited and they had to be damn good at executing their approach to get into the profit zone and to pay their bills at the end of the year! Otherwise it’s game over for them and their business.

Similarity with trading: As a trader you have also limited resources (money, time, nerves and health)!


What did ALL gold hunting teams do to get into the profit zone?

To answer the above question, I have another question for you.

Do you think that the gold hunters walked out of the door of their homes, placed their gold-digging equipment in their garden or on the next best grassland and then they started digging for gold relying on pure luck?

If your answer is NO, then you are correct!


A professional gold hunter would not simply rely on luck. A professional gold hunter does NOT start blindly digging for gold at random place, because the chances of finding gold at a random place are nearly zero.

The following illustration shows this fruitless approach:

Attached Image


Remember: The gold hunter teams have a lot of fixed costs. And they want to make a living from their profits. They can’t waste their energy/resources and rely on pure luck. They need to find a lot of gold (not only a little bit) to stay in the business (to cover their costs).

Therefore, they must only dig for gold at very promising spots.

And the same is true in trading, because you can compare the digging equipment of the gold hunters with your trading system/rule-set!
If you want to trade professionally then you should also, as the gold hunters, NOT rely on pure luck. And in terms of trading this means that you should NOT trade your system/rule-set at a random place in the chart. Instead you should apply your system/rule-set only at places (chart areas/price situations) where you will have a high chance for a winning trade.

MOST (MECHANICAL) RULE BASED TRADERS DON’T DO THIS AND, IN MY OPINION, THIS IS THE REASON WHY THOSE TRADERS LOSE. THIS IS ALSO THE REASON WHY FULLY AUTOMATED EA’s, WHICH ALSO ONLY EXECUTE MECHANICAL RULES, WILL FAIL IN THE LONG RUN.


I will give you a simple example what you should NOT do as a trader:

Let’s say that you trade a simple trading system which gives an entry signal when 2 moving averages are crossing. And let’s say that a crossover occurs which gives you a buy signal on the time frame H1. But when you zoom the chart out to H4 and D1 then you see that the buy signal occurred at a massive resistance level which will most probably hold. If the resistance level will most probably hold, then it’s quite logically that this buy signal of your trading system will most likely produce a losing trade. Therefore, you should NOT trade this signal!

In the example above, I explained a filtering mechanism. With such a filtering mechanism you can filter out a lot of bad trades and improve your winning percentage. Such a filtering approach can bring a net-losing or break-even trading system into the profit zone.

Most traders, especially novice traders, do not look at such things like the “bigger picture” of the chart situation. Therefore, they trade a lot of signals which have only a little chance of success. They could do much better if they would filter bad trading signals out.

Recap: Do not take any signal of your trading system blindly without looking at the bigger picture!

Attached Image (click to enlarge)
Click to Enlarge

Name: hunter2.png
Size: 41 KB


The filtering method explained above can already improve your trading performance a lot.

But there is an even better approach available than skipping bad signals!


An even better approach: Proactive trading!


From my experience, the best trading approach is when you actively search for the best chart situations which gives you a big advantage/edge over the market. And only if such a chart situation exists, then you wait until your trading system/rule-set gives you a signal into the same direction as the edge of the best chart situation.

The professional gold hunting teams in the Netflix documentary are doing exactly the same! They are digging for gold only at those spots where the probability of finding a lot gold is extremely high. They have even evidence that the chances are high at those spots based on soil analysis or geological conditions of the area etc. Only at those spots they can expect that they can cover their costs at the end of the year and make profits on top!

The following illustration shows what the professional gold hunters in the Netflix documentary are doing:
1. Go to the most promising area
2. Pinpoint the digging spot
3. Start digging

Attached Image (click to enlarge)
Click to Enlarge

Name: hunter3.png
Size: 45 KB


And for you as a trader this means:
1. Search for the best market situations
2. Pinpoint the best chart area
3. Execute your entry / exit rules

Attached Image


Jesse Livermore once said “Money is made by SITTING, not TRADING".

Now you know exactly what he meant!

You need to wait for the best chart situations which provide you the biggest possible edge over the market. Only if such a situation exists, only then you will open a trade which has the highest possibility of success.

The following explanations will go into more details how exactly you can find the best market situations.
 
2
  • Post #3
  • Quote
  • Edited 11:52am Oct 26, 2021 6:16am | Edited 11:52am
  •  FX-Mike
  • | Commercial Member | Joined Apr 2017 | 395 Posts
2. Setups vs Signals and Automation

To avoid confusion during my later explanations I want to distinguish some terms which I always use in my learning material. I will also explain why partial automation is everything you need if you trade besides your normal day job.

When I talk about trading setups, then I mean a chart situation where you have a high chance for a winning trade.

When I talk about trading signals, then I mean the entry timing according to the rules of a trading system (e.g. our systems V-Power, Double Top/Bottom, STME).

If you read the explanations of my previous post then you already know that the chart situation (the bigger picture, the high probability area for a successful trade) corresponds to the left and the middle part of the following illustration.

And the trading system (with that I mean the entry/exit rule-set) that you use to exploit the high probability chart situation corresponds to the right part of the following illustrations:

Attached Image


During the past years I received the same question from my customers a thousand times:

“Why don’t you create a fully automated expert advisor?”

And my answer is always this:

“Because it’s not possible to create a successful EA which as good as a partially automated EA! And a partial automation is everything you need to trade successfully besides your day job. With a partial automation you have only a few minutes of work per day. Don’t be lazy and try to automate those few minutes!”

I will explain the reason:

If you read about artificial intelligence (AI) programs then you will notice that those programs are specialized for one single use case. E.g. there is an AI that brought the chess game to perfection. No human can beat this AI in a chess tournament anymore. The AI program was able to learn chess to perfection because chess has a limited set of rules. But this specific AI can’t do anything else than playing chess.

There is no “general artificial intelligence” which learns the rules of the complete physical world and all the complex relationships that we humans are able to understand. A “general artificial intelligence” is simply not possible because there is no limited set of rules to define the complete physical world.

For trading this means:
We (the humans) have to find the best chart area with the highest probability for a successful trade visually, because the whole trading thing has too many rules and can’t be programmed into an EA (at least not as good as the judgement of the human eye/brain).

On the other hand, an Expert Advisor is a perfect fit for the time-consuming but easier part of trading, like waiting for the entry signal, opening and closing the trade.

In the following illustration you can see which part can be automated and which not:

Attached Image


Only a few minutes per day!

Many of our members trade successfully with partial automation while they only spent a few minutes per day for trading.

Maximum automation:
1. visual analysis
2. entry/exit automation

Medium automation:
1. visual analysis
2. real-time signal via email
3. visual check
4. manual entry

Attached Image


Daily Coaching / Analysis

Me and my team are analyzing the charts every day and we post the best chart situations into the telegram groups.

My personal goal here on ForexFactory with this thread is the same. First, I need to explain the basics and then later I will also post the best chart situations and live trades in this thread.

Attached Image
 
3
  • Post #4
  • Quote
  • Edited 9:34am Oct 28, 2021 5:48am | Edited 9:34am
  •  FX-Mike
  • | Commercial Member | Joined Apr 2017 | 395 Posts
3. Markets are similar to the Matroschka (a Russian doll)

The financial markets behave similar to the Russian doll named Matroschka. Small trend sizes are moving within bigger trend sizes. Therefore, the trend sizes are interrelated and nested.

The following illustration shows a Matroschka:

Attached Image (click to enlarge)
Click to Enlarge

Name: matroschka.png
Size: 153 KB


Depending on the definition there are 4 or 5 different trend sizes in every liquid financial market. These trend sizes are all interrelated and nested. The trend of the smaller trend size moves within the trend of the next bigger trend size.

I personally define 4 different trend sizes in forex and commodities. These different trend sizes are labeled with 1, 2, 3 and 4 in the following illustration:

Attached Image


A trend consists of “move phases” and “correction phases”. The move phases are stronger and bigger than the correction phases.

In the following illustration I have labeled the move phases of the biggest trend size (trend size 4):

Attached Image


As I already said, the trend sizes are interrelated and nested. With that I mean that e.g. a “move phase” of the trend size 4 consists of a complete trend of trend size 3.

During one move phase of trend size 4, the next smaller trend size 3 has multiple move phases and multiple correction phases. During the same time, the smaller trend sizes (1 and 2) have even more move phases and correction phases than trend size 3.

Another thing to mention: During a correction phase of an upward trend of size 4, the smaller trend sizes 3, 2 and 1 even show a downward trend, as shown in the following illustration:

Attached Image


The explanations above regarding the trend sizes are a simplification. I only wanted to show how the 4 different trend sizes of liquid markets are interrelated and nested. This concept will get very important later when we search for the best trading setups!

Recap: Things that occur on bigger trend sizes have always an impact on the lower trend sizes. Therefore, you should always have an eye on the bigger trend sizes even if you only trade on lower trend sizes.

As I already mentioned, I define 4 trend sizes for forex and commodities. The best time frames to see trend size 4 are the monthly and weekly chart. Trend size 3 can be seen on the daily and the H4 time frame. Trend size 2 can be detected on H1 and M30. Trend size 1 can be seen on M15 and lower:

Attached Image (click to enlarge)
Click to Enlarge

Name: trendsizes7.png
Size: 100 KB


When we trade our trading systems then we search for the best trading setups by consulting the time frames D1/H4/H1. These three time frames give you the information that you need to trade will full confidence when a trading signal occurs.

For our trading systems V-Power and Double Top/Bottom the trading signals are generated on H1 and M30:

Attached Image (click to enlarge)
Click to Enlarge

Name: trendsizes8.png
Size: 102 KB


For our trading system Strong Trends with Magic Entries (STME) the trading signals are generated on H1/M30/M15/M5 and even M1:

Attached Image (click to enlarge)
Click to Enlarge

Name: trendsizes9.png
Size: 105 KB

Next I will discuss why multiple edges at the same time bring a better performance/winning rate.
 
1
  • Post #5
  • Quote
  • Nov 9, 2021 8:05am Nov 9, 2021 8:05am
  •  FX-Mike
  • | Commercial Member | Joined Apr 2017 | 395 Posts
4. Multiple edges for an outstanding performance


In this post you will learn why using multiple edges from the bigger picture (which exist at the same time) will bring you an outstanding performance in your trading.

And you will also see why this is, in my opinion, the only way to be a constantly successful trader.

As I already explained in one of the previous posts, most traders simply follow a trading system (rule set) on a single time frame. They simply wait until an entry signal occurs and then they enter the trade into the direction of the signal.

Those traders are trading completely “blind” because they don’t know what happens on the bigger picture. Such traders are trading all signals of their trading system and they don’t know anything about the probability of each signal.

But this is a big mistake!

You can compare a trader who trades all signals of his trading system blindly with someone who is participating in a tug-of-war event and he does not know anything about his opponent. On top of not knowing anything about his next opponent, he is betting money on his victory in the next tug-of-war game.

You don’t know how big and strong your opponent is, but you are betting your money on your own victory in every game. Would you really do that if you know that from time to time you are facing extremely strong opponents?

The following illustration shows what I mean:

Attached Image


When you trade on lower timeframes like H1 then it will often occur, that you will get a trading signal which has very little chance to succeed.

For example:
A major support/resistance level could be in the way of your signal which prevents the price to move into your anticipated direction. Or a divergence between the price and an oscillator like the MACD on a bigger timeframe like H4/D1 could pull into the opposite direction of trading signal on H1.

Such chart situations from the bigger picture which have an impact against your trading signal will dramatically diminish the probability for a successful trade of your trading signal. This is because the bigger trend sizes have more power than the smaller trend sizes.

The following illustration highlights that you have little to no chance for a successful trade when an edge of the bigger picture works against your trading signal:

Attached Image


A first improvement of your profitability as a trader is to avoid to trade such low-quality signals:


Attached Image


This filtering method can already help you to transform a net-losing system or a breakeven system into a profitable trading system. But you can do it much better!


A much better approach

Besides avoiding the lowest quality signals there is a much better approach to trading. And that better approach is what we teach in our telegram groups and with our weekly emails.

Better approach: Trade only the best signals!

The following illustration shows the minimum requirement (the minimum quality of your trading setup/signal-combination) that we suggest for every trade.
You should only trade those trading signals of your system if at the same time at least 1 edge from the bigger picture helps your signal to move into your anticipated direction.

This will already help you to get a much higher winning percentage:


Attached Image


Since 2007 I have constantly researched new trading edges which work forever, because they are grounded on sound trading knowledge.

And over the years I got more and more patient to incorporate them into my trading routine.

My maturity regarding trading allows me now to wait for my very best trading setup which incorporates 4 trading edges from the bigger picture in combination with my entry signal.

The following illustration shows the power of my preferred setup type:


Attached Image


Such setups have the highest winning percentage. When you analyze my track record from my first post (links are available) then you will see that those setups bring a winning percentage between 80% and 90%.

Such a high winning percentage is easy to trade from the emotional side (little to no drawdown phases).

And I will now explain why every trader should go for such a high quality in his trading routine to raise the probability of being successful in the long term.


Crave for highest quality

From teaching and talking to thousands of traders during the past years I learned that nearly every trader that I met is heavily impacted by the trading results of the recent weeks. Nearly no one that I met can really think long term and evaluate a trading system after months or even years.

From that experience I draw my own conclusions why only a small percentage of traders make it in the long run.

Please have a look at the following illustration:


Attached Image


The left part of the illustration is clear. If the trading system has a negative outcome (it loses more money than it wins) then you can’t make money with. You can try to improve your skills at executing such a system but this will not bring you into the profit zone because you are following a rule set that loses money if you apply it hundreds of times.

The middle part of the illustration is a little bit trickier. Although you have a trading system that is slightly profitable most traders will lose money with such a “mediocre good” trading system. I mentioned the reason above. Most traders that I know are strongly affected by the results of the recent weeks.

A mediocre good trading system produces quite long losing streaks. But most traders that I know will stop trading a mediocre system because they get hit by a losing streak that lasts a few weeks or even longer.

The following illustration shows what I mean. If you start trading a new “mediocre good” trading system right before the next losing streak occurs then it can happen that you account is still under water (lower than you started with the new system) after you executed e.g. 70 trades.

Attached Image


Most people that I know will not trade this system any longer although they would make money with that system in the long run over the upcoming months and years.

Most traders who trade mediocre good trading systems are caught in the “system hopping cycle”:

They start trading with a new system, then they start losing money because of the normal drawdown phase, then they quit trading this system, then they search for the next system and repeat the complete cycle again.

I personally know people who did that “system hopping cycle” for over 10 years!

The following illustration shows how those people who are trapped in the system-hopping-cycle are losing money over the years, although maybe every trading system that they traded would have produced money in the long run:

Attached Image


The financial and emotional costs of such a trading “career” are a disaster.

In my opinion, the best way to succeed as a trader in the long run is to crave for highest quality and the biggest possible edge. Only if you trade an extremely good trading system, then the drawdown phases are minimized. Such systems are psychologically much easier to trade:

Attached Image


In the next post I will explain my best trading setup in detail. Stay tuned
 
1
  • Post #6
  • Quote
  • Edited 7:46am Dec 12, 2021 5:31am | Edited 7:46am
  •  FX-Mike
  • | Commercial Member | Joined Apr 2017 | 395 Posts
5. My favorite trading setup (PART 1)

My favorite trading setup is based on mini-bubbles and mini-crashes which usually develop every month a few times. I will use a mini-bubble example to explain the concepts. Everything that you will learn about the mini-bubble setup can also be used to detect mini-crashes into the opposite direction.

A perfect mini-bubble setup (and this is also true for a perfect mini-crash setup) is the most powerful setup that I know. Such setups are giving the biggest winning trades on average and such setups bring you the highest winning percentage! In the example below, you will see that the collapse of a bubble can be one of the most profitable price moves that you can spot on the charts.

Therefore, it is definitely one of the most important setup types that I can teach you

The mini-bubbles can be detected on the timeframe H1. Schematically such a setup looks as shown in the following sketch:

Attached Image (click to enlarge)
Click to Enlarge

Name: 2_bubbleSetup.jpg
Size: 60 KB


Such setups can be exploited with reversal signals at the absolute top of the bubbles immediately when the bubble starts to burst.

Our trading system V-Power and Double Top/Bottom give signals at those reversal points in real-time. If you want more automation, then you can even trade these setups fully-automatically while you are sleeping or while you are at work with EA-functionality (V-Power EA or DTB EA).

You can of course use any other reliable reversal indicator to detect reversal signals at the end of a bubble:

Attached Image (click to enlarge)
Click to Enlarge

Name: 3_bubbleReversalSignal.jpg
Size: 69 KB


Because the collapse of the bubble (the very strong and reliable downward move) is so powerful and long lasting, you can also easily enter with a trend following signal into the collapse.

Our trading system STME can give you trade entry signals in real-time during the collapse phase. And the STME-system gives you useful suggestions where to place your stop-loss with which you can optimize the risk/reward of your trade.

Of course, you can also use other reliable trend-based indicators during the collapse phase to jump on board of the profitable downward move:

Attached Image (click to enlarge)
Click to Enlarge

Name: 4_bubbleTrendSignal.jpg
Size: 67 KB


A perfect bubble setup where I’m most aggressive with my position size has 4 edges which helps the signal succeed:

Attached Image


The following H1 chart of a forex pair shows such a perfect bubble. The vertical dotted lines are the separators for the different trading days.

If you count the trading days during which the bubble developed you will see that it took around 17 days. This relatively short amount of time compared to months or even years which are needed to develop e.g. a stock market bubble lead me to the naming “mini-bubbles” and “mini-crashes”.


Attached Image (click to enlarge)
Click to Enlarge

Name: 7_chartBubbleComparison.png
Size: 58 KB


The left green dotted ellipse in the chart above shows the initial upward trend before the bubble develops. The red dotted ellipse shows the re-accumulation phase (I will explain that in detail in my next post) before the bubble starts. The right green dotted ellipse shows the bubble phase with an irrational steep upward move.

We will now examine how to detect absolute top of the bubble. This is the time before the bubble will most probably burst.

First, we can detect the start of the bubble by drawing a trend line which is connects the low(s) of the initial upward trend and the low(s) re-accumulation phase.

In MT4 we can now copy this line and move the copied line upwards until the copied line touches the highs of the initial upward trend. The two green lines in the following screenshot are giving us the trend channel of the initial trend.

As soon as the bubble begins, the price overshoots the trend channel to the upside. In this moment the price enters a strong overbought condition. A lot of free space is generated below of the price. Free space means that when the price returns back downwards there is little to no support and the price will usually drop very hard and fast.

The following chart shows the trend channel, the beginning of the bubble and the free space generated by the bubble:

Attached Image (click to enlarge)
Click to Enlarge

Name: 8_bubbleDetection1.png
Size: 45 KB


In our example, the price continues to move above the initial trend channel. New higher highs and higher lows are formed in the already overbought condition.

You can now draw new trend line by connecting the recent lows after the bubble started. You can then copy this trend line and move it to the highs which formed after the bubble started.

As a result, you will get a new trend channel which is shown in the following screenshot. I our example you can see that the second trend channel is even steeper than the first (initial) trend channel. This gives you an additional conviction that this crazy overbought market situation cannot last much longer.

In our example the price even made an overshoot of the second trend channel. Now the price is even crazier overbought. The free space (the area where the price has no support and will most probably drop through very hard) has now grown even more.

The following chart shows the crazily overbought situation which gives you the highest probability for a successful sell trade:

Attached Image (click to enlarge)
Click to Enlarge

Name: 9_bubbleDetection2.png
Size: 38 KB


At the absolute top of the bubble you will see regular bearish divergences. These divergences are showing you that the speed of the upward move is slowing down.

The subsequent fast price reversal to the downside will trigger V-Power sell entries and Double Top signals on M30/H1 near the absolute top of the bubble.

After the sell signal occurs you can see how strong and fast the price collapses. This is our high probability profit move for our trades through the free space area. Such trading setups have the highest winning percentage that I know (80% to 90%)!!

Later, during the downward move the STME system measures the speed of the move and gives you high probability trend continuation sell signals during the pullbacks.

The following chart shows the areas where you can expect the different signal types:

Attached Image (click to enlarge)
Click to Enlarge

Name: A_bubbleEntrySignals.png
Size: 32 KB


The following chart shows the 2 additional components which make the bubble setup absolutely perfect and nearly an absolute sure winner.

I mentioned the regular bearish divergence already. In the following chart you can see where it will occur. If the second trend channel overshoot additionally reaches a recent major resistance area, then you can expect that the price will be rejected to the downside immediately and very hard.


Attached Image (click to enlarge)
Click to Enlarge

Name: B_bubble4Edges.png
Size: 41 KB


In my next post I will explain WHY these setups occur and why they are nearly “compelled/forced” to work as predicted.

So please stay tuned
 
2
  • Post #7
  • Quote
  • Dec 14, 2021 6:19am Dec 14, 2021 6:19am
  •  FX-Mike
  • | Commercial Member | Joined Apr 2017 | 395 Posts
My favorite trading setup (PART 2) – Why it works!


ATTENTION:
If you have never before heard of smart money and how it behaves in every financial market, then this post can contain the most important trading knowledge that you learned until now.

What do I mean with “smart money”?

In every financial market there is a dominant group of market participants. Some people call them market makers. I call them “the smart money”.

The members of this dominant group are working together and they are working as “one force” against all other (smaller) market participants. The smart money is moving the biggest position sizes in the market and it has the best information insights.

Therefore, the smart money has an unbeatable advantage. The smart money always makes money, every month and every year.

In forex trading the smart money consists of the 8 biggest international mega banks (Citigroup, Deutsche, Barclays, …). Those 8 banks are responsible for 70% of the daily trading volume in the complete forex market.

Please think about the hundreds of thousands of other market participants. I call those market participants “the herd”. The herd is moving only move 30% of the daily volume! And members of the herd are NOT working together. Instead, the members of the herd are even fighting against each other to make a profit.

ATTENTION:
As I said, the smart money is working together as “one force” against the herd. And the smart money is moving 70% of the daily volume in the forex market and it has the best market insights/information. Therefore, the smart money has the biggest “muscle”. The smart money will win EVERY fight against the herd! Therefore, your biggest goal is as a trader should be to join the smart money and take the same side of the trade!

If the price is running against the position of the smart money then the smart will reverse the direction of the price movement (the trend) whenever it wants! Once the average price of the position of the smart money is in profit, then the smart money starts distributing the position to the herd.

The smart money is always moving between the two cycles “accumulation” and “distribution”. The smart money accumulates its position at cheap prices then it drives the price into the necessary direction to get the position the profit zone. Then the smart money distributes the position with profits to the herd before the smart money starts accumulating again.

I know what you probably think now. If you never heard of these concepts, then this information be quite confusing or unclear at the moment. But I will explain everything in detail. Then you will understand it for sure and then you will know how to exploit the behavior of the smart money

The following explanation is a brief version of the article series from my website. If you also want to read the longer and more detailed version, then please visit my website here:
Smart Money Article 1
Smart Money Article 2
Smart Money Article 3
Smart Money Article 4


The smart money in the forex market

As I already mentioned above, the smart money which moves 70% of the daily forex volume consists of the following 8 mega banks:

Attached Image


These megabanks are using the interbank market to trade with each over. The purpose of the interbank market is to define a BID and an ASK price for each currency pair.

Because the megabanks are defining the BID/ASK prices, they are acting as market makers.


The herd in the forex market

The members of the herd of the forex market are shown in the following sketch. Those smaller market participants are usually NOT trading on the interbank market directly. They are usally trading on smaller networks like Currenex, HotspotFXi, Integral and so on.

Attached Image


The interbank market is absorbing the imbalance of the herd!

As you probably know, for each buyer there need to be a counterpart (a seller) and vice versa.

If the herd is mainly buying then there are more buyers than sellers within the herd. But who takes the other side of the buy positions if there are not enough sellers within the herd?

The imbalance of the herd is absorbed by the interbank market! Therefore, the megabanks get automatically the counterpart of the imbalance of the herd.

The following sketch shows that if the herd is net long then the megabanks are automatically net short:

Attached Image


And vice versa, if the herd is net short then the megabanks are automatically net long:

Attached Image


This automatic absorbing of the imbalance of the herd is what makes the smart money fighting the herd every day in the forex market. And you can easily guess who will win the fight, which means which group makes profits with trading and which group loses money on average


Emotions of the herd

The herd tends to follow the trend.

This means that with rising prices the bullish herd turns more and more net long. Because of their emotions the herd tends to add the biggest amount of long positions at the highest prices:


Attached Image


Vice versa, the same is true on declining prices. The bullish herd is capitulating at the most wrong prices and is throwing the most amount of short orders into the market when the prices reach the bottom of the curve:

Attached Image


When the prices start rising again then the bullish herd repeats the same wrong behavior:

Attached Image


The bearish herd does the SAME ERRORS into the opposite direction.

The bearish herd gets most exited near the bottom of the curve there way initiate the most amount of short orders.

Attached Image


The bearish herd capitulates usually at the highest prices:

Attached Image
 
1
  • Post #8
  • Quote
  • Dec 14, 2021 6:28am Dec 14, 2021 6:28am
  •  FX-Mike
  • | Commercial Member | Joined Apr 2017 | 395 Posts
As a result, the bullish AND bearish members of the herd are opening the MOST AMOUNT OF BUY ORDERS AT THE TOP OF THE CURVE:


Attached Image


And vice versa, the bullish AND bearish members of the herd are opening the MOST AMOUNT OF SELL ORDERS AT THE LOW OF THE CURVE:

Attached Image


The smart money does AUTOMATICALLY the opposite of the herd!

The black guy in the following sketch represents the smart money (the megabanks) in the forex market.

The smart money is automatically absorbing the imbalance of the herd. And as we learned from the behavior of the herd, the smart money has the biggest short position at the absolute top of the curve and the biggest buy position at the absolute bottom of the curve.

Transition of the position of the smart money on rising prices:

Attached Image


Transition of the position of the smart money on declining prices:

Attached Image


And because the smart money has the biggest muscle (remember they trade 70% of the total volume) the smart money can also EXACTLY DEFINE THE MARKET BOTTOMS AND TOPS.

At market tops and bottoms the smart money plays their final reversal games before they reverse the direction of the trend. When the trend direction reverses then the profit taking of the smart money begins. At the end of the trend the accumulation phase begins again.

The following sketch shows you again that the smart money takes the opposite action of the herd:

Attached Image


Now we have learned the behavior of the smart money. And you have learned that the smart money ALWAYS WINS.

Therefore, the best thing that we small traders can do is to JOIN THE SMART MONEY

ALL MY TEACHINGS AND MY TRADING SYSTEMS ARE ALL ABOUT:

DETECT THOSE SITUATIONS WHERE THE SMART MONEY HAS ACCUMULATED A LOT! AND I MEAN AN EXTREME AMOUNT OF EITHER BUY OR SELL POSITIONS. BECAUSE THEN YOU KNOW THE UPCOMING DIRECTION WITH HIGHEST PROBALITY! BECAUSE THEY NEED TO DISTRIBUTE AGAIN WHAT THEY HAVE ACCUMULATED! AND THE BIGGER THE ACCUMULATED POSITION SIZE THE BIGGER THE PROFIT MOVE IN WHICH WE CAN PARTICIPATE!

In the next post I will explain why my preferred bubble setup from my previous post is so successful. As you maybe already assume, It relates to the accumulated position size of the smart money
 
2
  • Post #9
  • Quote
  • Dec 19, 2021 9:42am Dec 19, 2021 9:42am
  •  FX-Mike
  • | Commercial Member | Joined Apr 2017 | 395 Posts
Bubble Chart example from this week:

This week I announced a bubble setup on USDCAD in the free telegram groups and on the website. In fact, the setup was announced 2 days before the entry signal occurred. So there was plenty of time to prepare and to activate the ExpertAdisor for real-time alerts or even automatic entries.

Here is one of my announcement messages:

Attached Image


And this is how the bubble finally collapsed:

Attached Image (click to enlarge)
Click to Enlarge

Name: screenshot.png
Size: 100 KB


USDCAD gave a nice profit move to the downside as expected

Members of the telegram group enjoyed a nice winning trade:


Attached Image (click to enlarge)
Click to Enlarge

Name: screenshot.png
Size: 1.4 MB
 
3
  • Post #10
  • Quote
  • Apr 6, 2022 4:47am Apr 6, 2022 4:47am
  •  FX-Mike
  • | Commercial Member | Joined Apr 2017 | 395 Posts
Live trade today on EURUSD:

Attached Image


This is a V-Power buy entry signal

Read more here and download the free version:

https://www.perfecttrendsystem.com/d...-forex-v-power

Attached Image

Read more about the DTB Alerter and DTB EA here:

http://www.perfecttrendsystem.com/do...bottom-alerter

https://www.perfecttrendsystem.com/d...expert-advisor

This setup is not a bubble/crash setup but it has enough edges to be a good buy setup. The edges are:

- multiple steep downward days (creates free space to the upside for a profit move)
- a recent support level was taken out (stop hunt + reversal)
- a nice V-shape formation formed on h1 (a typical intraday trend reversal)
 
 
  • Post #11
  • Quote
  • Apr 6, 2022 8:09am Apr 6, 2022 8:09am
  •  FX-Mike
  • | Commercial Member | Joined Apr 2017 | 395 Posts
The second partly position was opened by the Double Top/Bottom EA during the pullback. Now the price seems to explode to the upside and fill the free space (free space = green ellipse):

Attached Image (click to enlarge)
Click to Enlarge

Name: screenshot.png
Size: 31 KB
 
 
  • Post #12
  • Quote
  • Apr 6, 2022 12:27pm Apr 6, 2022 12:27pm
  •  FX-Mike
  • | Commercial Member | Joined Apr 2017 | 395 Posts
Update regarding the EURUSD. It was closed with a small profit because I will leave the house in a few minutes and I prefer to open and close trades at the same day. The target was missed by 2 pips or so. That's trading...

Attached Image

Attached Image (click to enlarge)
Click to Enlarge

Name: screenshot.png
Size: 164 KB


Here is the chart from the moment when I closed the trade with a small profit:

Attached Image (click to enlarge)
Click to Enlarge

Name: screenshot.png
Size: 195 KB

Good trading is waiting patiently for good setups. Therefore, I will now wait for the next good chance.

7 of our members got prop traders with our systems and countless members got profitable. These members have also understood that waiting for the best setups is the key to trading success.

Read here about the members who got prop traders.
 
 
  • Post #13
  • Quote
  • Edited 9:55am Apr 8, 2022 4:15am | Edited 9:55am
  •  FX-Mike
  • | Commercial Member | Joined Apr 2017 | 395 Posts
On Wednesday EURCHF had a similar setup as EURUSD which I posted live here.

In contrast, EURCHF reached the target within 5 hours. EURCHF produced a V-Power buy signal and then exploded to the upside:

Attached Image (click to enlarge)
Click to Enlarge

Name: screenshot.png
Size: 43 KB


You can download the free version of V-Power. After downloading, you will also get access to the public telegram group where you will receive setup announcements every day for free.

On Wednesday, we also watched for buy trades on EURAUD and GBPAUD in our telegram groups. I will now post my explanations which I made in the free telegram groups:

=====

As Thorsten and I pointed out recently, GBPAUD and EURAUD have produced a free space to the upside. The pairs did not qualify for a mini-crash but they had 4 steep downward levels which created some space to the upside.

Therefore, they were no candidates for a level1 trade (catching the falling knife) but they were candidates for V-Power buy and double bottom signals.
I posted this chart where I labeled the free space with the green rectangle:

Attached Image (click to enlarge)
Click to Enlarge

Name: screenshot.png
Size: 436 KB

And this is how EURAUD behaved:

Attached Image (click to enlarge)
Click to Enlarge

Name: screenshot.png
Size: 395 KB

Sadly both pair did not provide a V-Power buy or double bottom signal. For a signal to develop, yesterdays low would have needed to go lower than Mondays low.

The following screenshot shows the price action that produced the corresponding buy signals:

Attached Image (click to enlarge)
Click to Enlarge

Name: screenshot.png
Size: 440 KB


With this dip below Mondays low you would also see a perfect bullish divergence between price and the MACD which is one of our edges that we use for our trading:

Attached Image (click to enlarge)
Click to Enlarge

Name: screenshot.png
Size: 447 KB


And the dotted ellipse in the following screenshot shows the part of the free space which gets filled with highest probability:

Attached Image (click to enlarge)
Click to Enlarge

Name: screenshot.png
Size: 450 KB


Successful trading, especially in the forex market, is all about knowing WHEN you have an edge, when to trade and especially when not to trade.


Recently I got the following 5star review from a trading veteran with 30 years of professional trading career, which makes me very proud

Attached Image (click to enlarge)
Click to Enlarge

Name: screenshot.png
Size: 150 KB
 
 
  • Post #14
  • Quote
  • Apr 8, 2022 5:37am Apr 8, 2022 5:37am
  •  FX-Mike
  • | Commercial Member | Joined Apr 2017 | 395 Posts
Live trade from today in the group (target was reached very fast within 1 hour):

Attached Image (click to enlarge)
Click to Enlarge

Name: screenshot.png
Size: 38 KB


Here are the messages from the group:

Attached Image (click to enlarge)
Click to Enlarge

Name: screenshot.png
Size: 272 KB

Attached Image (click to enlarge)
Click to Enlarge

Name: screenshot.png
Size: 324 KB


The trade was based on a signal of the FREE Double Top/Bottom Indicator which is used since 2017 by thousands of traders.
 
 
  • Post #15
  • Quote
  • Apr 14, 2022 5:46am Apr 14, 2022 5:46am
  •  FX-Mike
  • | Commercial Member | Joined Apr 2017 | 395 Posts
Enjoy the newest blogpost: Excerpt from the coaching program

You will learn about good setup selection which give you a huge edge over the market:

Attached Image (click to enlarge)
Click to Enlarge

Name: screenshot.png
Size: 254 KB


Also you will learn about triple swing divergences which usually produce a big and strong reversal.

Such setups are the reason why your target price can be reached nearly immediately:

Attached Image (click to enlarge)
Click to Enlarge

Name: screenshot.png
Size: 117 KB
 
 
  • Post #16
  • Quote
  • Last Post: Apr 14, 2022 12:17pm Apr 14, 2022 12:17pm
  •  FX-Mike
  • | Commercial Member | Joined Apr 2017 | 395 Posts
Yesterday I warned a member in the free double top/bottom group who was in a buy trade on EURUSD, that a stop hunt to the downside will occur.

I pointed out the reasons why a momentum/intraday trade (yesterday in and yesterday out) could make sense. But a holding during multiple days is risky because of the anticipated stop hunt.

Today the stop hunt occurred as expected. Only now the way is free to the upside (in my opinion).

You can join the group for free by downloading the free Double Top/Bottom indicator: FREE DTB Indicator

Here are the screenshots of yesterdays and todays explanations:

Attached Image (click to enlarge)
Click to Enlarge

Name: screenshot.png
Size: 272 KB

Attached Image (click to enlarge)
Click to Enlarge

Name: screenshot.png
Size: 221 KB

Attached Image (click to enlarge)
Click to Enlarge

Name: screenshot.png
Size: 239 KB
 
 
  • Commercial Content
  • /
  • Trading With Extremely Good Edges
  • Reply to Thread
0 traders viewing now
Top of Page
  • Facebook
  • Twitter
About FF
  • Mission
  • Products
  • User Guide
  • Media Kit
  • Blog
  • Contact
FF Products
  • Forums
  • Trades
  • Calendar
  • News
  • Market
  • Brokers
  • Trade Explorer
FF Website
  • Homepage
  • Search
  • Members
  • Report a Bug
Follow FF
  • Facebook
  • Twitter

FF Sister Sites:

  • Metals Mine
  • Energy EXCH
  • Crypto Craft

Forex Factory® is a brand of Fair Economy, Inc.

Terms of Service / ©2023