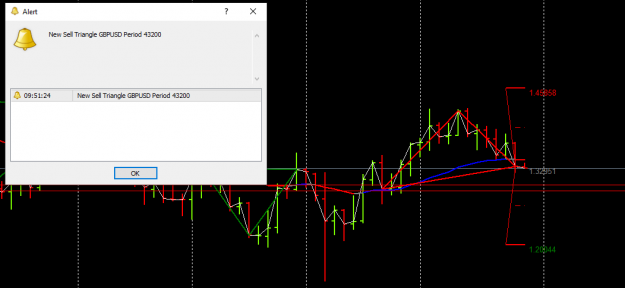
Disliked{quote} Can you explain to me how to use the Alans_target indicator please? It draw like 50 lines on the chart and I have no idea what Triangle_MaxSize, Active_Triangles, etc. mean. Thanks a ton {image}Ignored
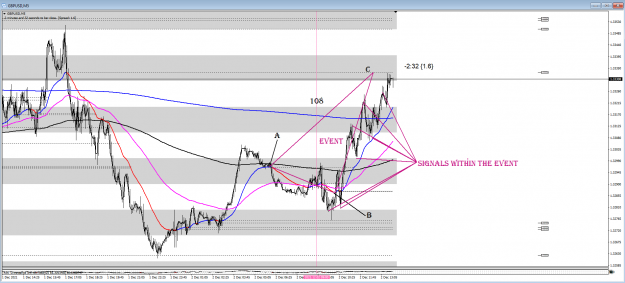
What it does is that it points out a special kind of divergence which very often has a specific target to attack.
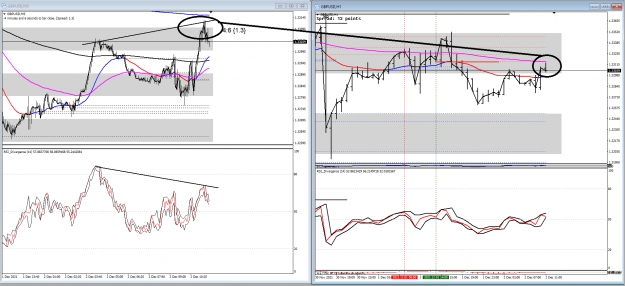
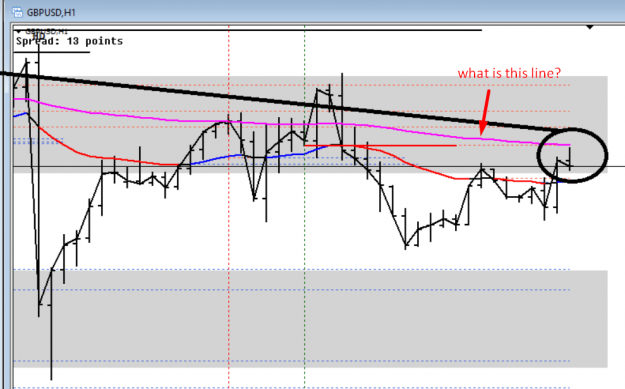
The lines you are seeing are the 50% target level and the 100% target levels in both directions. So if one is indicated on the 1 hour chart these levels become ZOO points for considering on the lower time frames.
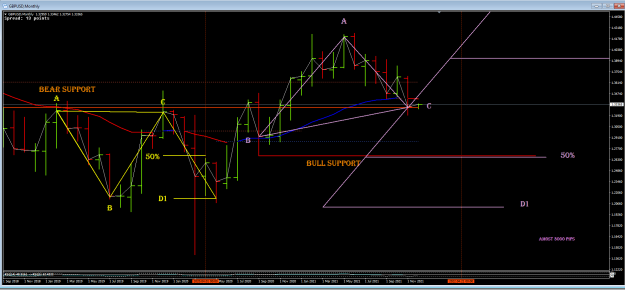
Here for example is a very long term one on the monthly I have just drawn in for you.
Attached Image (click to enlarge)
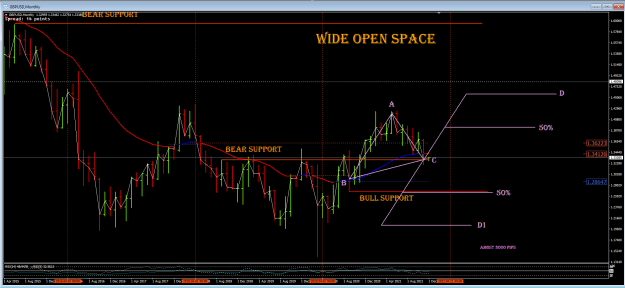
The monthly chart is far too long for my tastes so I limit myself to the 1 hour but that is not to say I don't keep an eye on these higher time frames.
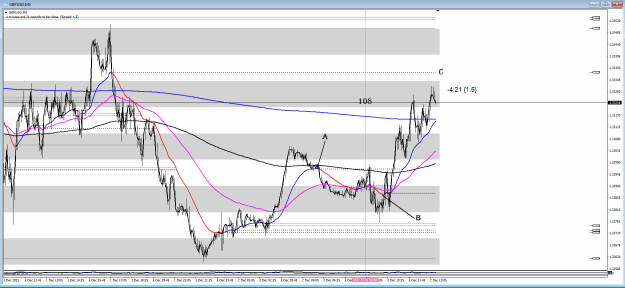
You should note the distance from A to B is the same as the distance from C to D.
And B and C are on opposite sides of the EMA which is a divergence.
2