{quote} Hi Steve You are quite correct that tick volume in my opinion is just a "activity metric" of tick activity, not volume which is of course executed market orders.. An extreme one minute candle at a reversal point can produce volume levels 30 to 50 times above average on just one candle. You won't see that much of a difference on a tick volume indicator between candles, its god dam fraud. Its the basic question really, why don't the brokers show us real volume levels when they can. Of course they don't want to give us any useful tool that...
Ignored
@RickM -- I'm questioning your comment about brokers being scammers because they don't show us real FX volume levels. Brokers who support MT4 don't have a choice what data they can show us -- they license the MT4 trading platform from MetaQuotes and their data from some liquidity provider (I presume). If MT4 doesn't provide a way to stream real FX volume data to end-users of the trading platform then MetaQuotes shares the blame. To be honest, I'm not really sure how all this works under the covers, but limitations of the trading platform (intentional or not) may also play a role.
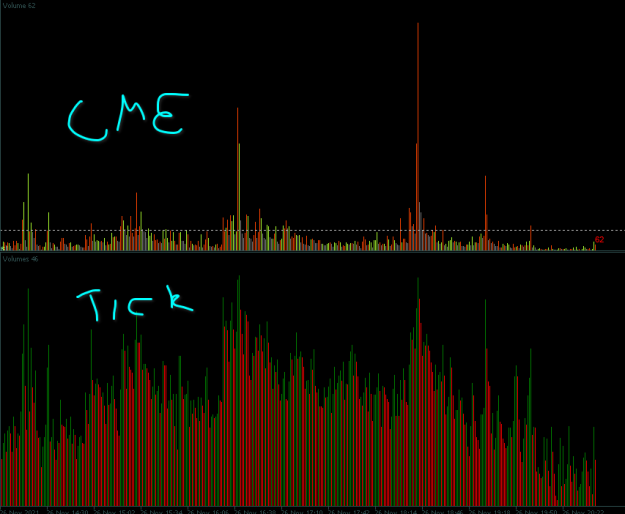
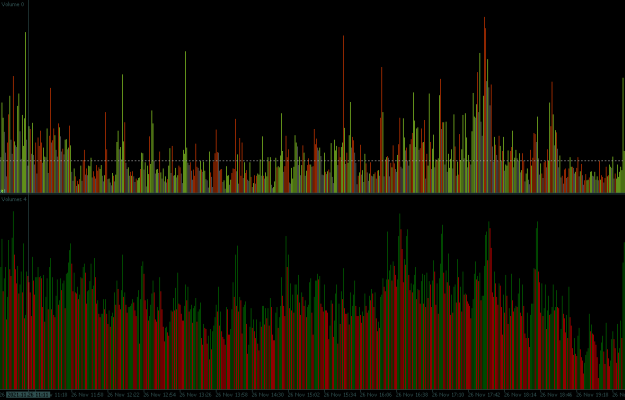
{quote} @W0lfram -- very interesting, thanks... Unless I'm reading it wrong, it looks to me like they match up pretty closely...
Ignored
Yeah, different values but overall 'shape' almost the same. But at some points, the values do not differ much.
Unfortunately I can't export time-series for correlation analysis
{quote} Yeah, different values but overall 'shape' almost the same. But at some points, the values do not differ much. Unfortunately I can't export time-series for correlation analysis
Ignored
"Unfortunately I can't export time-series for correlation analysis"
@W0lfram -- I don't know if I would worry about that since visual confirmation is pretty strong. Plus, since the market is constantly changing then the percent correlation is also likely to change. The take-home lesson seems to be that tick-volume versus contracts is pretty darn close -- so, if you don't have access to contract data and you want to include FX volume data in your trading then tick-volume may be "good enough". Trading strategies embrace statistics and probaility -- so, we should anticipate and accept there will be some "wiggle-room" in any analysis.
And here's a tip for anyone who is interested -- from informal testing and analysis it appears to me that tick-volume activity really kicks in when ADR is around 50%. So, an edge might be to wait until ADR is around 50% to determine the direction of your trade. Just saying...
{quote} @RickM -- I'm questioning your comment about brokers being scammers because they don't show us real FX volume levels. Brokers who support MT4 don't have a choice what data they can show us -- they license the MT4 trading platform from MetaQuotes and their data from some liquidity provider (I presume). If MT4 doesn't provide a way to stream real FX volume data to end-users of the trading platform then MetaQuotes shares the blame. To be honest, I'm not really sure how all this works under the covers, but limitations of the trading platform...
Ignored
Hi Steve
There is plenty of available indicators that for a monthly fee, will attach to a MT4 program to show real volume levels of various markets. I used to use one from FXCM called real volume which was a free indicator that showed volume directly off the FXCM forex network if you traded on their platform.
It was discontinued I think two years ago - typical
Most other indicators take their volume readings directly from the Futures markets which some traders feel is unreliable - I see no problem myself.
The catch is the fee
Trading thin liquidity at the boundary of the charts
After much study of the Forex market, and the implementation of various strategies and indicators, I have come to the conclusion that most of what I have learned, and most of what is being taught, is unreliable. Moving average crosses, supply and demand zones, volume profile, tick volume, MACD, RSI, channel trading, Bollinger bands, sentiment trading, psychological levels, most candlestick patterns, etc..., all seem to be unreliable when it comes to having a substantial win rate resulting in good profits by the end of the year. The people marketing...
Ignored
If I understood correctly then what you are talking about is edge from the signal alone. Guessing that you suggest use of equal TP/SL in order to measure win ratio and thus edge. Is that the reason you refer to 50% win rate as minimum so much?
Signal alone is just a pointer with probability which indicates that certain market behavior could happen. If the trader studies market behavior after the signal(pointer) then he could be able to define expected behavior after it. Introducing SL and TP would allow to measure if signal is providing edge, but use of SL and TP is part of risk management and start of trading system. So in a way it is not possible to find out edge of signal/pointer without introducing risk management. One could argue that simple hard stop and hard target can be used to measure edge of signal. In that case system is not obligatory to provide >50% win ratio. In that case win ratio for profitability is defined by RR parameters. If risk to reward is 1:3 then win ratio to be profitable should be above 25%. In this case, if win ratio is 40% then edge is 15%(40-25).
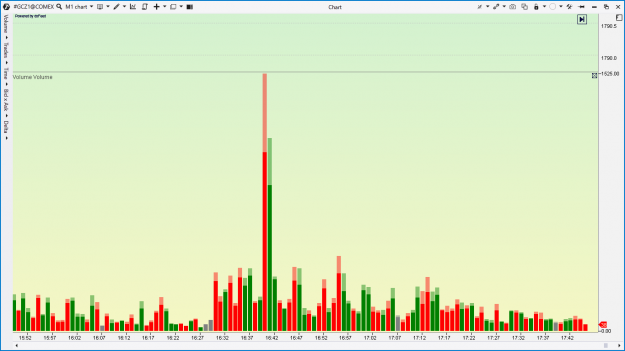
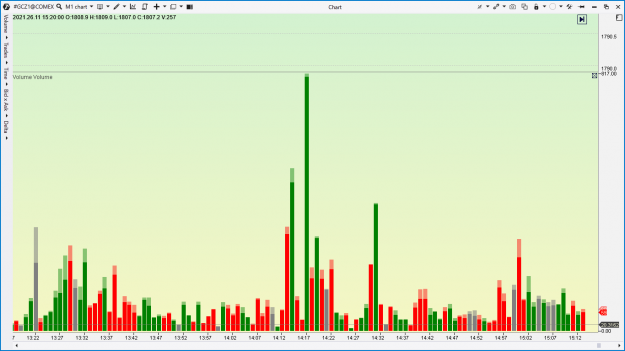
Ticks vs Contracts (opacity 50%) Gold, Nov 26, UTC+2, m1{image}{image}
Ignored
Unfortunately this comparison make no sense. Market is when buyer meets seller. There must be some data where trader can see how many order were bought, how many were sold. With current broker! Not somewhere else. Because If I sold here, who the heck bought it? Guy from another broker? How? There are no such an integration between brokers.
{quote} Unfortunately this comparison make no sense. Market is when buyer meets seller. There must be some data where trader can see how many order was bought, how many was sold. With current broker! Not somewhere else. Because If I sold here, who the heck bought it? Guy from another broker? How? There are no such an integration between brokers.
Ignored
Liquidity providers use computers to handle small retail trader positions. Brokers are just intermediaries. Brokers may provide direct access to liquidity provider or larger brokers may act as liquidity providers themselves.
{quote} Liquidity providers use computers to handle small retail trader positions. Brokers are just intermediaries. Brokers may provide direct access to liquidity provider or larger brokers may act as liquidity providers themselves.
Ignored
Yes, you absolutely right. But the question was that forex tick volume data is not volume data at all. So you confirmed it once again. But to understand that you can just compare tick volume data with real volume data. There are no secret at all. So I think since >90% will lose anyway there is no need to route your trade to the real market and no broker do it.
Anyway the topic was that indicators are unreliable. They are reliable. But there are no volume data on forex. But it is not so hard to get real volume data if you need.
{quote} If I understood correctly then what you are talking about is edge from the signal alone. Guessing that you suggest use of equal TP/SL in order to measure win ratio and thus edge. Is that the reason you refer to 50% win rate as minimum so much? Signal alone is just a pointer with probability which indicates that certain market behavior could happen. If the trader studies market behavior after the signal(pointer) then he could be able to define expected behavior after it. Introducing SL and TP would allow to measure if signal is providing...
Ignored
Indeed, risk management plays an important role in the success of a trader. But It is my belief that unless your win rate is above 50%, then you really don't have an edge.
{quote} So comparison of the 'real' volume per bar from CME and the same bar data from CME processed as ticks make no sense. Got it. Thanks.
Ignored
Don't know what you all are trying to compare. This is Friday's Gold.
Attached Image (click to enlarge)
This is EU
Attached Image (click to enlarge)
This is GU
Attached Image (click to enlarge)
The purpose to use volume/delta is to take trades. It is impossible to take trades using tick volume data because it is not a traded volume data. It is "curve the edge" synthetic bullshit to draw candles that must look like real.
{quote} Don't know what you all are trying to compare. This is Friday's Gold. {image} This is EU {image} This is GU {image} The purpose to use volume/delta is to take trades. It is impossible to take trades using tick volume data because it if not a traded volume data. It is "curve the edge" synthetic bullshit to draw candles that must look like real.
{quote} I have provided screenshots from EU and GU. They are the same. Please check.
Ignored
Yes, but not at first. You updated your post with more screenshots. When you originally posted your comment, it was only dealing with information concerning gold. You know this.
When I realized that you updated your comment, then I deleted my comment.
{quote} Hi Steve You are quite correct that tick volume in my opinion is just a "activity metric" of tick activity, not volume which is of course executed market orders.. An extreme one minute candle at a reversal point can produce volume levels 30 to 50 times above average on just one candle. You won't see that much of a difference on a tick volume indicator between candles, its god dam fraud. Its the basic question really, why don't the brokers show us real volume levels when they can. Of course they don't want to give us any useful tool that...
Ignored
Thank you for saying that Rick. It is so sad that there are some very large threads talking about volume spikes in a decentralized market. But hey, people like colorful charts. And some of these threads have some very colorful, albeit meaningless, charts.
If you are good at something, never do it for free--Joker