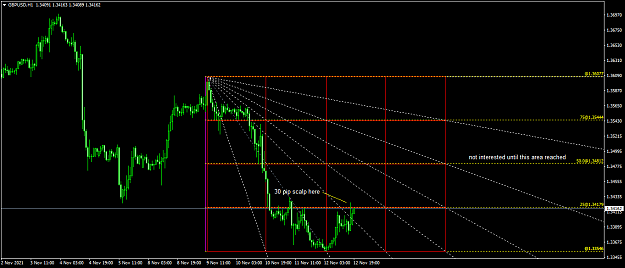
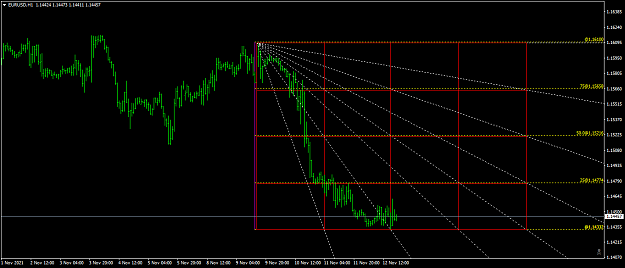
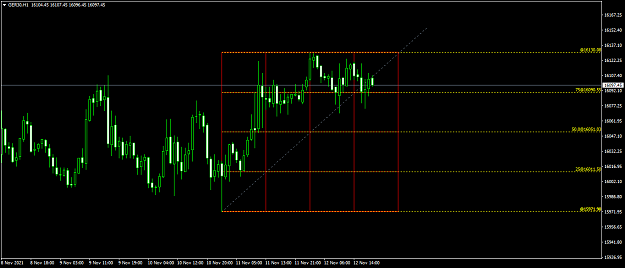
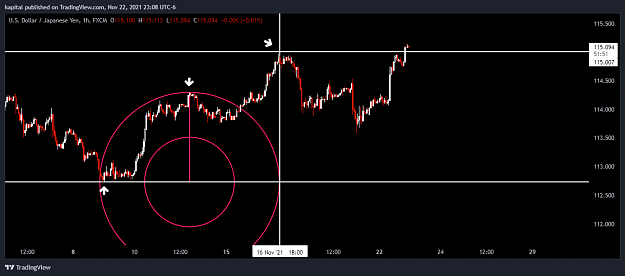
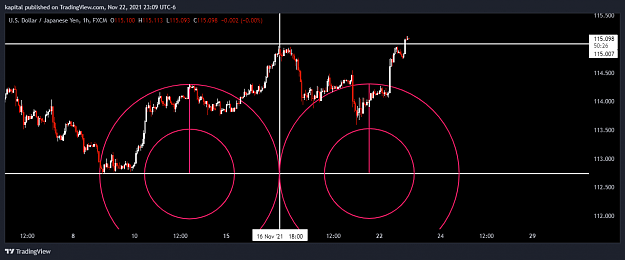
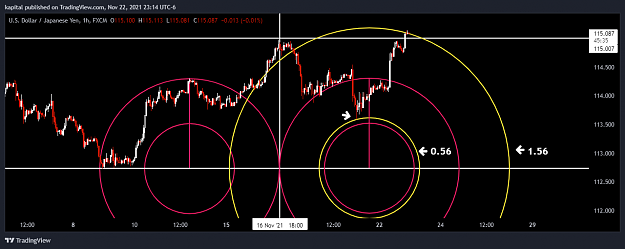
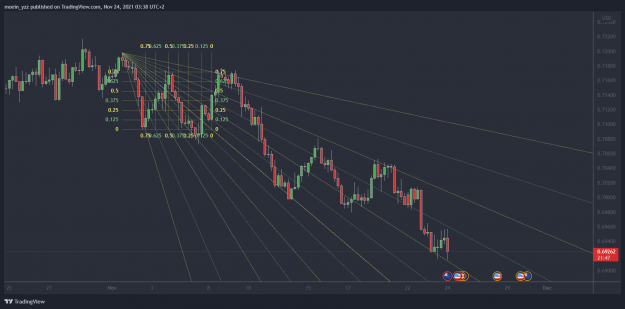
Parisboy showed us the Octave Doubling Process Here is my attempt after Squaring the Chart Set once then forget {image} {image} {image}
Ignored
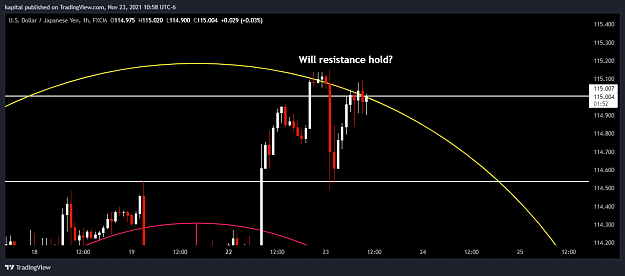
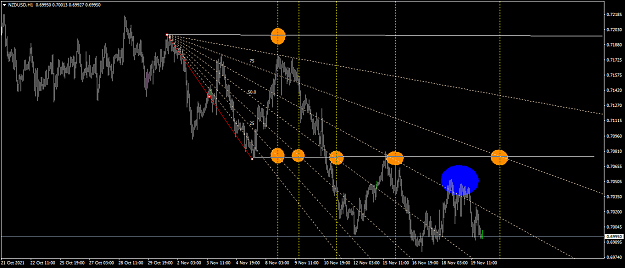
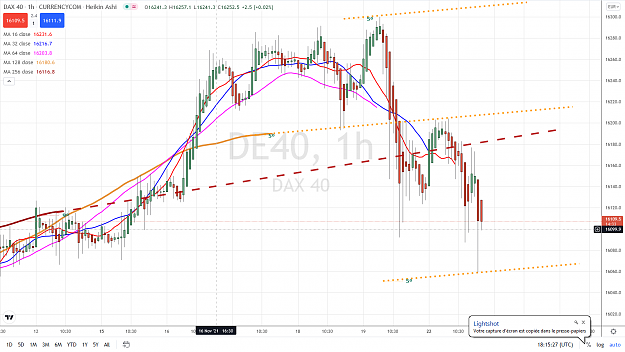
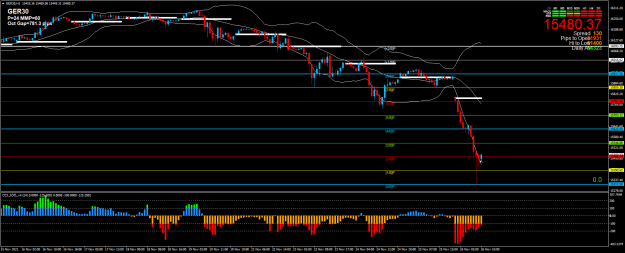
I really agree with the concept...several ways to double, or half a range, and divide out significant levels using diagonals....way more accurate than using indicators which are too late often...One thing that is a problem with doing that with indices, is the overnight trading after the main sessions are done...the overnight trading can throw out the concept significantly...so I guess the solution would be end of day charts that only draw the main sessions....here is the one hour...seems like 13 was the top...
Hey guys.
Wishing everyone good days, good deeds, and healthy days.
Been busy experimenting a lot with the knowledge I took away from this thread, so pardon my absence.
I renounced MetaTrader as it constantly lacked the precision I wanted. The experiences became very frustrating as my lines kept moving around and I kept getting resistance on one time frame, ending up with support on another.
I started using TradingView a couple days ago and it's proven much superior and easy to command. If anyone's having hard times with MT4, I suggest you try tradingview some time. It it very smooth.
Attached Image (click to enlarge)
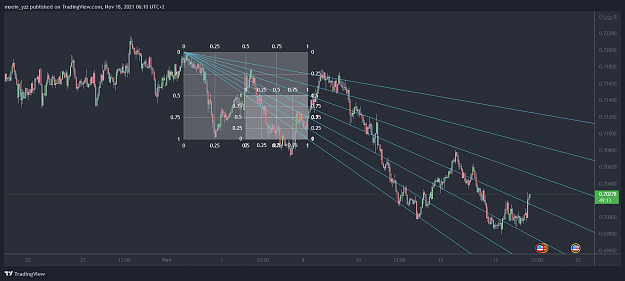
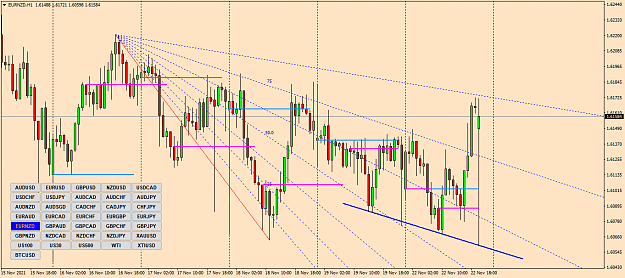
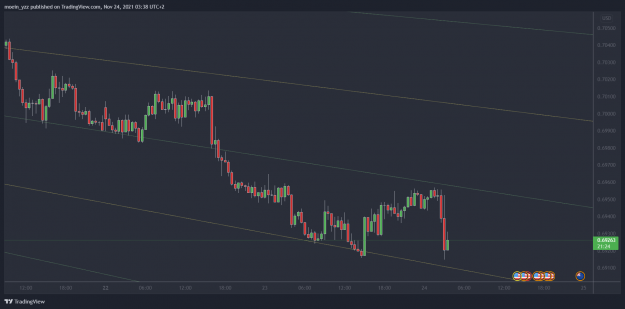
Wanna share a buy trade I got running in NZDUSD. Breaking above a line, retesting it and showing support. Will need monitoring to see if it holds up.
I've been halving my diagonals as the chart went further and further, which is equivalent to squaring the square. And it's proved very practical.
Wanted to share with you guys and see if anyone'll find it useful.
Hey guys. Wishing everyone good days, good deeds, and healthy days. Been busy experimenting a lot with the knowledge I took away from this thread, so pardon my absence. I renounced MetaTrader as it constantly lacked the precision I wanted. The experiences became very frustrating as my lines kept moving around and I kept getting resistance on one time frame, ending up with support on another. I started using TradingView a couple days ago and it's proven much superior and easy to command. If anyone's having hard times with MT4, I suggest you try tradingview...
Ignored
'
Hope you caught a few pips on that one....diagonals when used properly also tell you quite plain when to take profit of get out...pretty clear once the diagonal was challenged several times and failed....
Another way to analyse your chart, using the same high but measuring the low from the next wave down , is to use the fib fan set in 8ths....where is crossed the high or low mark with a verticlal line...often gives you a very precise turning point, expecially on daily charts...
I agree Mt4 can be a challenge, but I found there are cons on tradingview also...
{quote} ' Hope you caught a few pips on that one....diagonals when used properly also tell you quite plain when to take profit of get out...pretty clear once the diagonal was challenged several times and failed.... Another way to analyse your chart, using the same high but measuring the low from the next wave down , is to use the fib fan set in 8ths....where is crossed the high or low mark with a verticlal line...often gives you a very precise turning point, expecially on daily charts... I agree Mt4 can be a challenge, but I found there are cons...
Ignored
Hey Swede. Hope you're doing great.
First off, thanks so much for the advice and showing the ropes. This thread is my favorite thread because of all the great feedback, esp from you.
That Fib fan actually is a great tool now that I see. I've often wondered how to use that, now I see we can actually use the fans to shortcut the trendline drawing from the square everytime. Saves a lotta time. Can't believe I missed that lol.
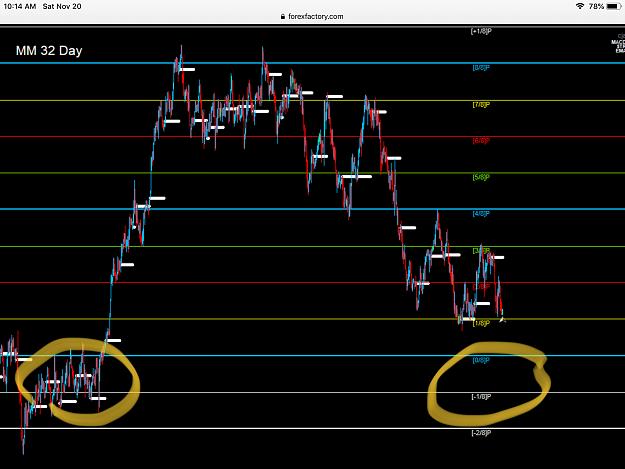
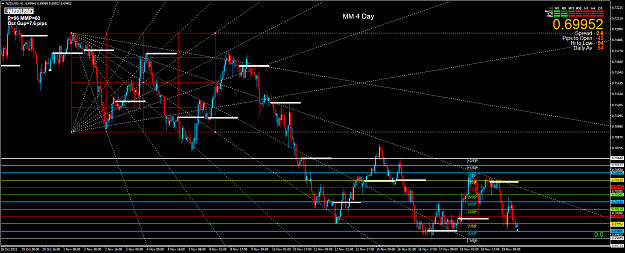
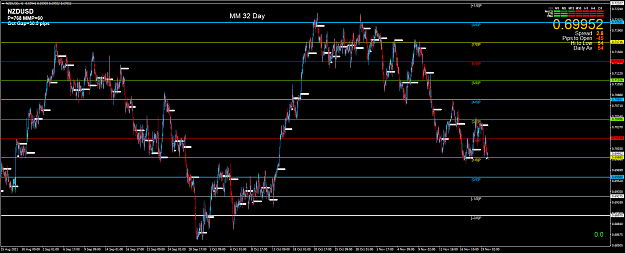
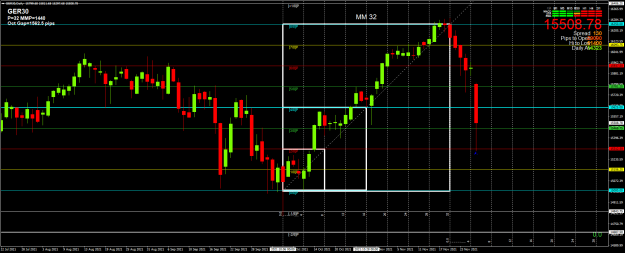
A little Confluence if needed ? {image} {image} {image}
Ignored
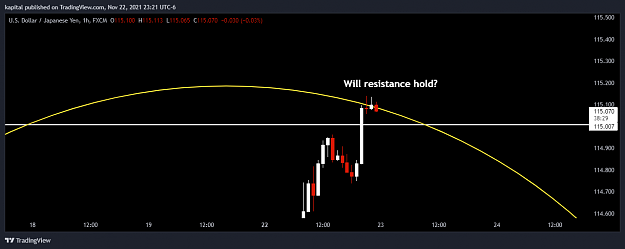
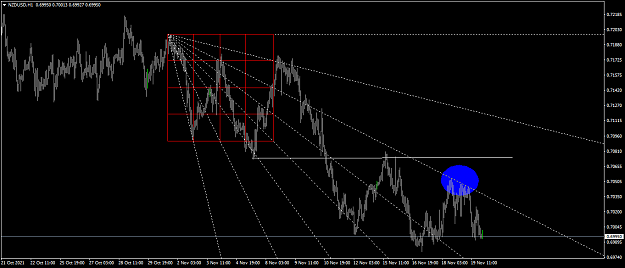
looks like make or break area to me,,,,worth keeping on the radar for certain...a brake should target 69 quite easy imho...watch USDX and Euro for clues as to strength and direction..
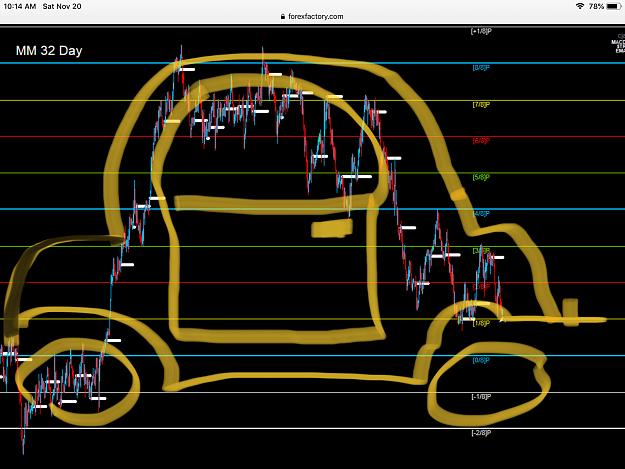
(catch this one one right and we can drive to the bank in OAPDave’s new electric Mercedes car)
{quote} looks like make or break area to me,,,,worth keeping on the radar for certain...a brake should target 69 quite easy imho...watch USDX and Euro for clues as to strength and direction.. (catch this one one right and we can drive to the bank in OAPDave’s new electric Mercedes car) {image} {image}
Ignored
Swede
Really like that drawing
It reminds me of my saying
If my eyes don't see it, it aint there
{quote} Swede Before we found the Grid Box Diagonals and in my case Murrey, we were both I guess trading with other methods We have been talking about Confluence So in a funny sort of way, your Grid box and Murrey acts as confluence to my old trading method, this gave my the choice to check each one against each other, seeing the strength's and weakness of each individual ( indicator ) Obviously you can go over the top with Confluence but by saving different templates does help take a little stress away from your eyes Just my view anyway {image}...
Ignored
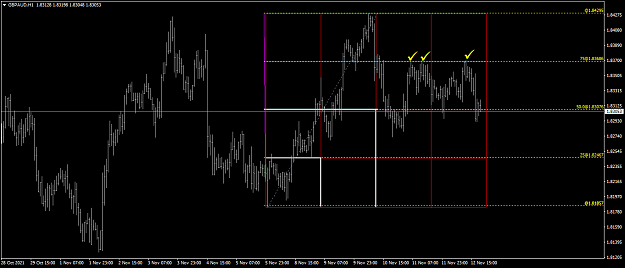
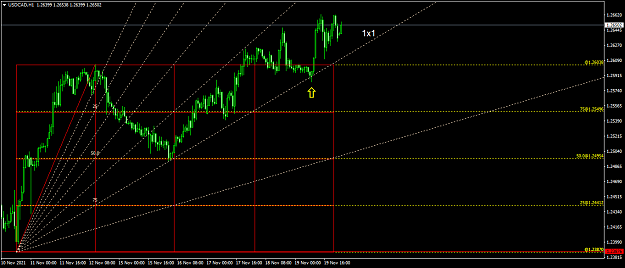
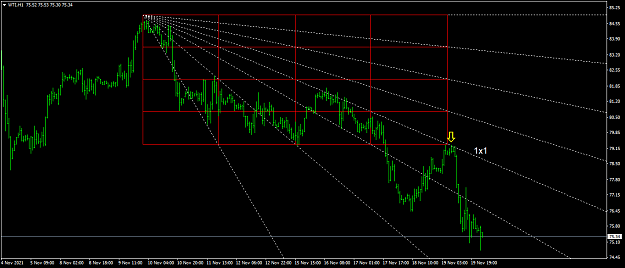
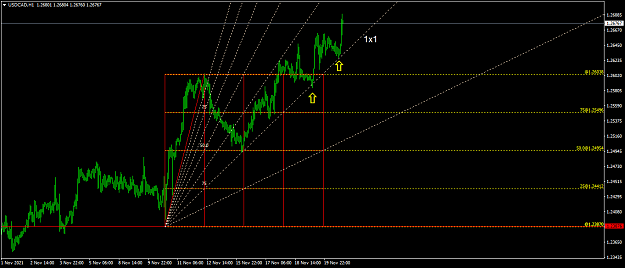
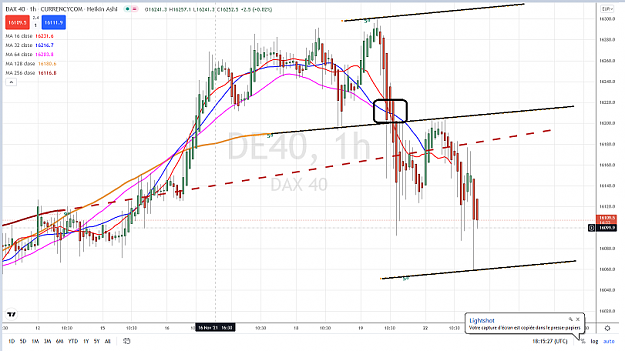
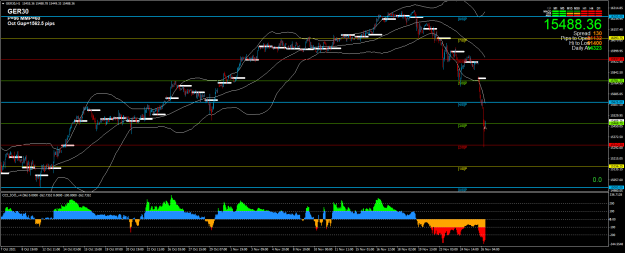
I totally agree, I seldom enter a trade without confluence, seldom trade just on the grid or diagonals...but there is one diagonal I always pay attention too and that is the 1x1....example below....