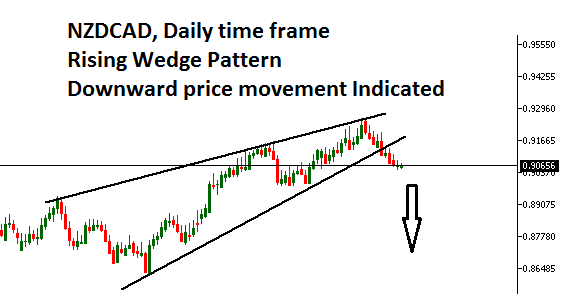
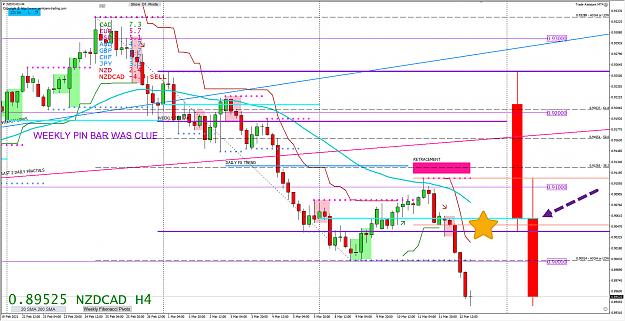
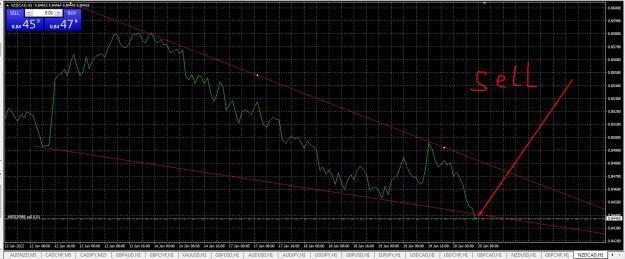
NZDCAD, Daily time frame
Rising Wedge Pattern
Downward price movement Indicated
#fx #forex #nzd #cad #forextrader #fxsuit #forexsignal #forexnews #ForexMarket #forexmentor #forexstrategy #forexmoney #forextrading #forextrade #forexlife #forexnews
Kindly follow for the latest trade ideas; https://twitter.com/james43416802
https://www.instagram.com/elliotfxwave/
Attached Image