{quote} I don't understand the attitude, but it is what it is Any other capable coders can create this excellent Indicator, please? With the addition of input for suffix as well as the time frame change for all open charts? Thank you very much appreciated
Ignored
Please remember to include in your specifications that you require programmers to write documentation/setup instructions for you. That is a unique requirement from your side that is normally not included in the free package and need to be explicitly mentioned.
{quote} Please remember to include in your specifications that you require programmers to write documentation/setup instructions for you. That is a unique requirement from your side that is normally not included in the package and need to be explicitly mentioned.
Ignored
Please butt out, you already said you were not interested!
What is in the package is between my new programmer and me; what may be unique for you is normal for others BTW.
In fact, we will keep it Private
Thanks for your concern but it's nothing to do with you.
{quote} Please butt out, you already said you were not interested! What is in the package is between my new programmer and me; what may be unique for you is normal for others BTW. In fact, we will keep it Private Thanks for your concern but it's nothing to do with you. Are we done here? Yes, I am.
Ignored
LOL, I don't mind not poking into your business if you stop poking into mine and whatever work I have done for other people as well and also stop creating trouble on my other threads to write things uninvited. If you stop all these and stop interfering with the stuff I do, then I am done too.
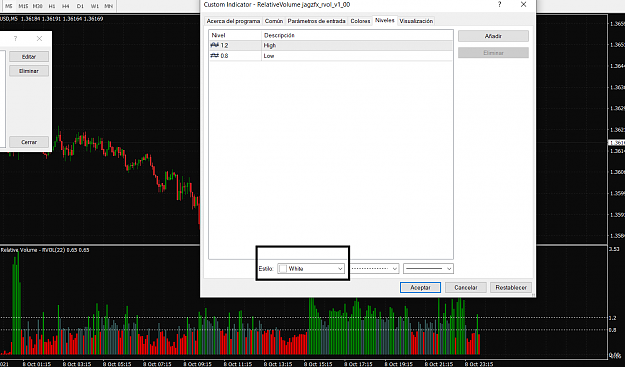
I found this code for an indicator called RVOL (Relative Volume) but it´s for MT5. If anyone could convert for us to MT4 it would be great. You can´t find this indicator anywhere, not even for sale at MQL5 community. This indicator will analyze "X" amount of days (user input) to give an average of the volume that happened at each session. You can easily see if the volume in the particular session is higher or lower than average, something that is hard to do with regular volume indicator. Here an image as an example, and I have attached the code...
{quote} I don't understand the attitude, but it is what it is Any other capable coders can create this excellent Indicator, please? With the addition of input for suffix as well as the time frame change for all open charts? Thank you very much appreciated
Ignored
what is going on? why he is showing this type of attitude? i am shocked.
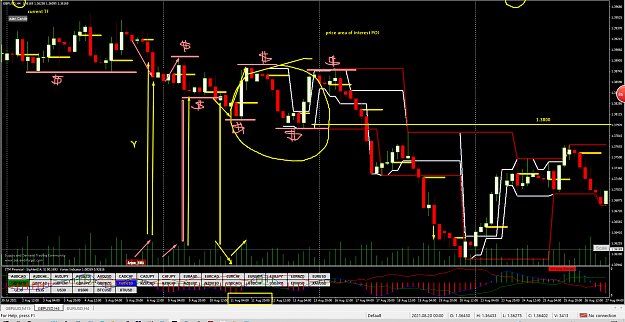
Could a generous coder of this forum help me to write the ea for this strategy.
1/ trading from each day from 600 to 1800 from M15, H1, H4 preferable option to set favorite TF, buffer to avoid price move exactly to limit of MP for trigger pending STOP orders then later kill them by hitting their SL, option for aggressive level of entry; option for optimlse TSP play (testing and detail later when original testentry step0+plan1+plan2 executed ten opening way for optimise TSL)
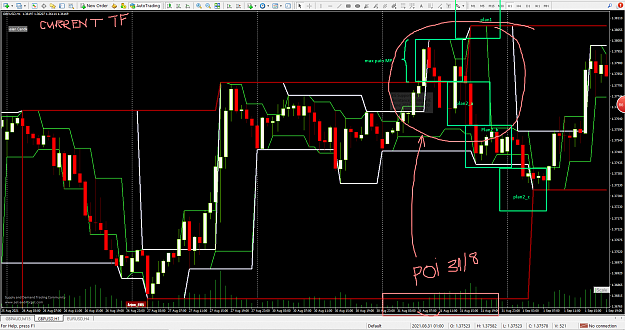
2/ find interesting level to determine max pain MP
3/ use MP to setup plan1 (in price move direction) and plan2 (counter current price move direction) with TEST entries, then pending Stop Buy, Stop Sell orders SL, TP levels calculated on MP and for test entry level
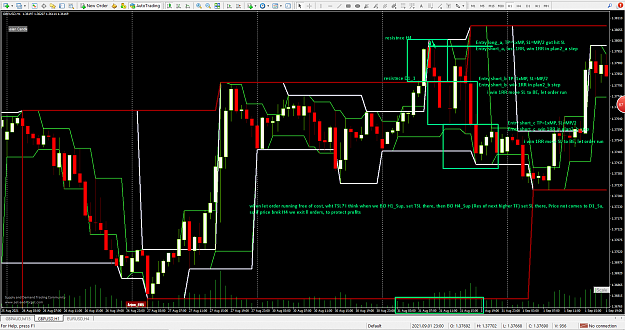
4/ if price move according plan1, continue plan1_a, plan1_b, plan1_c , cancel plan2's orders, follow TSL plan by checking prior Res/Sup levels; following exit stratergy
5/ if price move according plan2, continue plan2_a, plan2_b, plan2_c with entries, SL, TP levels, cancel plan1's orders; follow TSL plan by checking prior Res/Sup levels; following exit stratergy
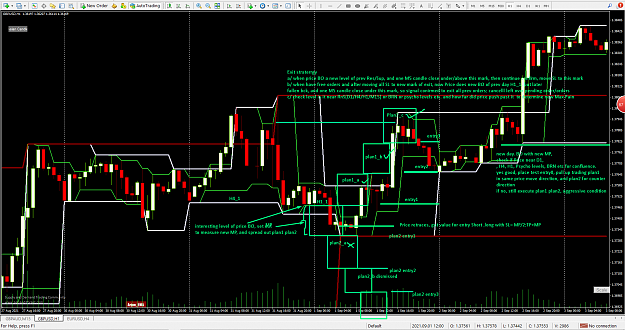
6/ when all orders exited, check price relation BO/touching a new interesting level RnS (D1/H4/H1/M15), psycho levels, BRN
case MP=10 pips
1/ if test entry follow of plan1 failed loss 5 pips, but win test entry of plan2 5 to 10 pips, cancel plan1 orders; continue plan2 saltep a/b/c, if win a, BE in b, exit all, still won 5pips etc ... if win a, win b won=5+10= 15 pips, if win a, b, c won=5+10+10 jackpot as now all orders still running free of costs
UPDate:
For the Sup/Res I use a modified KG resistance support, all credit due to trader KG
for BRN, psycho levels I use a modified key levels, all credit due to trader Bike883
Do you think it is pheasible to do in coding, I can do manual but hard work, lots of stress to tpe all the numbers for SL, TP in all the 7 pending orders, plus my broker is ecn, no SL/TP until they give ticket, often when try to set SL before in pending orders, orders were just open and close immediately cost money; hence I like to have SL/TP but hidden
UPDate:
like option for scan on several markets, (EU,GU,UC,UJ,CJ)but check limit of open orders, available margin, keep tab/alert of potential market, but only execute test+plan1+plan2 in case margin sufficiently allows
{quote} P.S: I updated the file to v1.01 because of a bug I just found. Those who have downloaded v1.00 earlier, pls download again. Your specifications this time is a vast improvement, very clear =) I used the standard 28 pairs by default, if you also use exotic pairs etc, you can always define them in the input parameters. {image} {image} {file}
Ignored
Thank you very much !
Experts can help me -all about one picture
Here is it
{quote} what is going on? why he is showing this type of attitude? i am shocked.
Ignored
Well, since people like you doesn't like to be rejected when programmers turn down your request and expect people to always say yes to all your requests, and whenever people say no to your request, you are not happy and keep emphasizing to the whole world "He refused to do it/ He doesn't want to do it", this sentence is not said to me, but I have seen you said this on other programmers, and obviously your post is showing displeasure about my past rejection of your request, not realizing this is a voluntary thread where people help according to their goodwill and their preference, freely given freely take, no programmer here is at your beck and call, unless you are willing to pay them a monthly salary. I think it's not worthwhile for me to help in this thread anymore given the fact that people here doesn't give the proper respect to programmers, demand this, demand that, demand documentation, demand that you have to do every changes every single one on this forum asks for. For those who I have helped and given appreciation to me and the other programmers, I have enjoyed working with you guys, and I'm sure other programmers would enjoy working with you too, just that not everybody here is like that, so with this, I will end my contribution on this thread and will not participate in coding requests in future. I don't have anything to lose by not participating, and in fact gain more personal time for family and friends. Good luck.
Good day coders.Could you please help me code an EA with the following strategy:
Parabolic SAR
Step:0.002
Maximum:0.2
With a trailing stop,TP and SL input.
{quote} You would be taking away the most useful part of the indicator by doing this. Why not just use a Heiken Ashi histogram instead? Alternatively, you can use the Heiken Ashi Tape indicator.
Ignored
million thanks dear
the heiken ashi histogram you mentioned is very useful filter
but the idea of the requested modification on better volume indicator is to trade on color patterns so if you can help i will be very appreciated
Hey developer friends, someone generous to accomplish this? ,
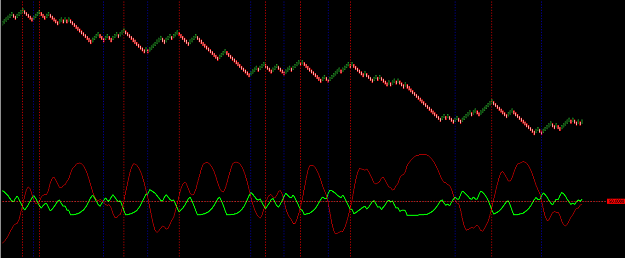
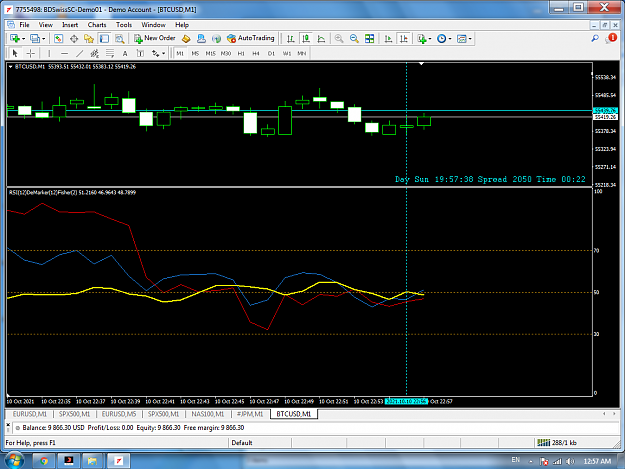
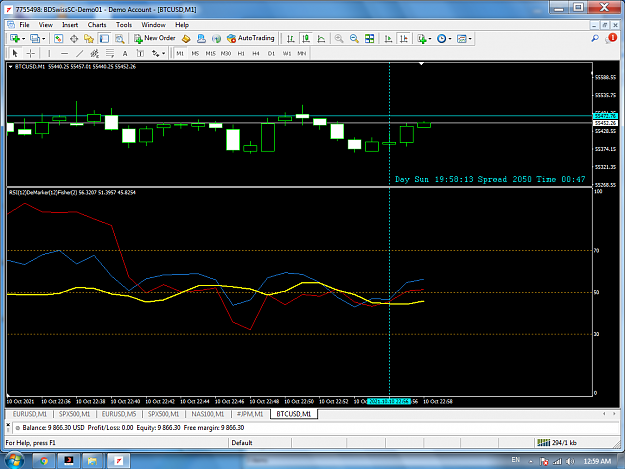
In the chart window, enter the RSI_DeMarker_Fisher indicator twice.
Attached Image (click to enlarge)
We only need Fisher, others (RSI / DeMarker) can be excluded from the indicator.
The rule is:
When you have Fisher's cross, open the arrows on the graph and notice the vertical dotted lines in the image.
The indicator will be two Fisher in a single indicator.
Please is it possible to do this with this indicator?
* Updated, I forgot to inform that one Fisher is flip true and the other flip false.
In this image the red Fisher is a false flip and the green Fisher is a true flip.
sorry for the update
/John
{quote} million thanks dear the heiken ashi histogram you mentioned is very useful filter but the idea of the requested modification on better volume indicator is to trade on color patterns so if you can help i will be very appreciated
Hey jeanlouie, In the chart window, enter the RSI_DeMarker_Fisher indicator twice. {image} We only need Fisher, others (RSI / DeMarker) can be excluded from the indicator. The rule is: When you have Fisher's cross, open the arrows on the graph and notice the vertical dotted lines in the image. The indicator will be two Fisher in a single indicator. Please is it possible to do this with this indicator? {file}Thank you always for your attention. /John
Ignored
it's clear with a Fisher, you need two period settings,
and rsi and demareker are the same need different period settings?
Hey jeanlouie, In the chart window, enter the RSI_DeMarker_Fisher indicator twice. {image} We only need Fisher, others (RSI / DeMarker) can be excluded from the indicator. The rule is: When you have Fisher's cross, open the arrows on the graph and notice the vertical dotted lines in the image. The indicator will be two Fisher in a single indicator. Please is it possible to do this with this indicator? {file}Thank you always for your attention. /John
Ignored
Guys,beware about naughty "fisher" code part,i doubts repainting same as rest of fisher participations where it is -