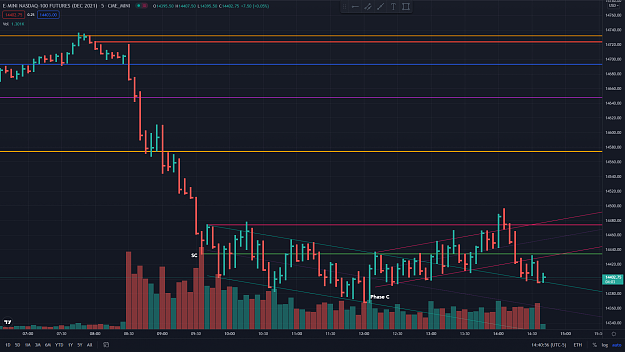
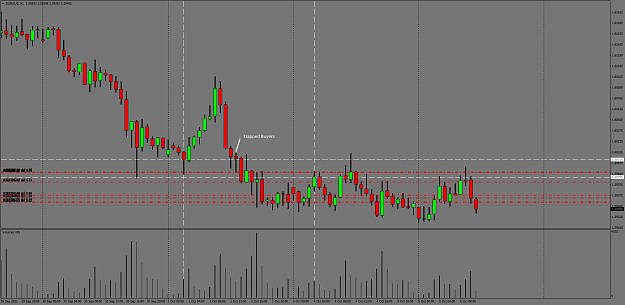
DislikedI liked the bottom HVZ from the Wednesday though, as it looked like the boundary lines/Phase A of an accumulation schematic, with the first breakout of the range showing a wyckoff SOS, which proved to be the case in the end, with entry taken at the LPS/HB.Ignored
I will only have two Zones on my chart at a time: Yesterday's HVZ (YHVZ) and in certain cases Today's HVZ (THVZ). And I would only use Today's HVZ when price is a significant distance away from YHVZ.
I think the more Zones on the chart, the less clean-looking it becomes. Additionally, in my hierarchy of Zones, Yesterday's HVZ and Today's HVZ are at the top.
Without VSA, you're playing checkers while the Smart Money plays chess.
5