DislikedInteresting chats from you guys. RickM's comments regarding his previous experiences using "standard" VSA got me thinking.... Ive noticed that forex and forex education has become alot more mainstream over the past 2-3 years. Prop firms seem to be a big deal now, you no longer have to start off with £1000 and attempt to compound your account over years and years, you can take £500-£800 and buy yourself an evaluation for a 200k account, and there is pretty much no ceiling now as to how much funds you can have to trade with. ( I know this cos ive...Ignored
I will just make one comment then disapear into the sunset because I changed my view 15 years ago on VSA - for the better as well.
If we see a large bearish candle that shows a large tick value on a spot FXchart, I used to think in was probably Buyers entering the battle to combat the sellers - then creating a bullish move the other way soon after.
Whats the problem with that, it makes sense doesn't it. A big candle is a large war with the new army normally winning the battle because they are less combat fatigued.
But the truth is there are 4 possibilities.
A.. Strong selling then some large long orders coming in to stop the bearish move.
B.. Strong selling to exhaustion of Bids, and I mean zero buyers in the market within spread distance.
C.. Strong selling with long order blocks to halt movement but lack intend to create a bullish market.
D.. Strong selling with major long order blocks to creating an Ask imbalance of more than 3 to 1 - a bullish trend.
Which one is it?
Without knowing, its guess work and I don't feel comforable with that position - I like many professionals need to see the delta.
Cheers
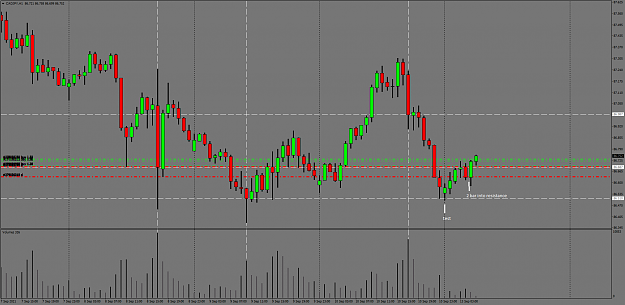
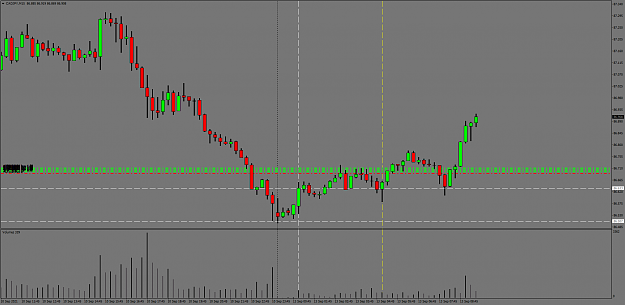
Trading thin liquidity at the boundary of the charts
5