Dear coders, this is an indicator that shows historical Support Resistance.
I ask if you can include the following:
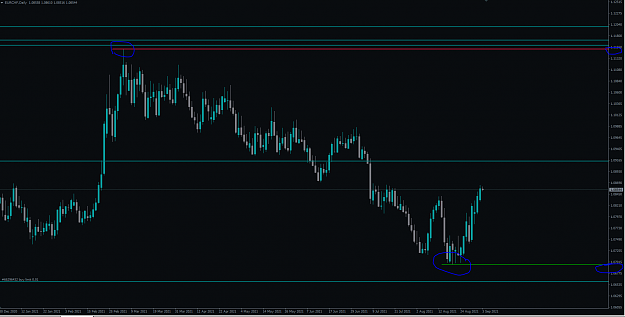
1.- Historical highs in red, historical lows in green (perhaps the option to select the desired color)
2.- the option of being able to visualize the price of the maximum or minimum, in the price scale.
Thank you for your collaboration, I am very grateful for the great work you do.
I attach an example of the graph
Thanks
I ask if you can include the following:
1.- Historical highs in red, historical lows in green (perhaps the option to select the desired color)
2.- the option of being able to visualize the price of the maximum or minimum, in the price scale.
Thank you for your collaboration, I am very grateful for the great work you do.
I attach an example of the graph
Thanks
Attached Image (click to enlarge)
Attached File(s)
Attached File(s)