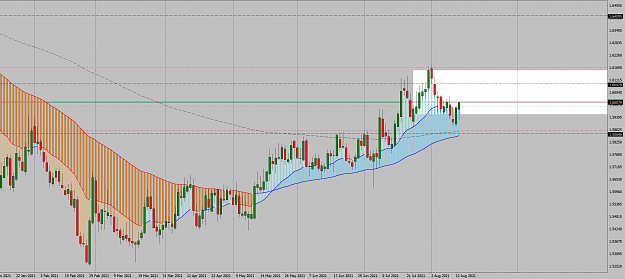
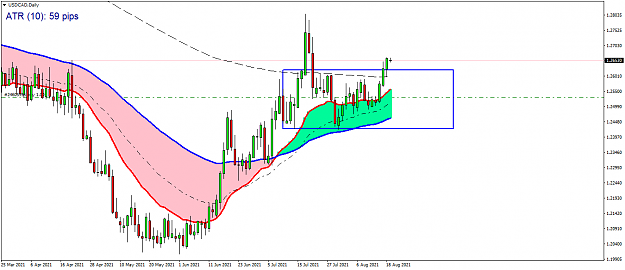
{quote} I seen this morning big move very close to target and I close with big profit {image}here its beter view in my enter and exit {image}
Ignored
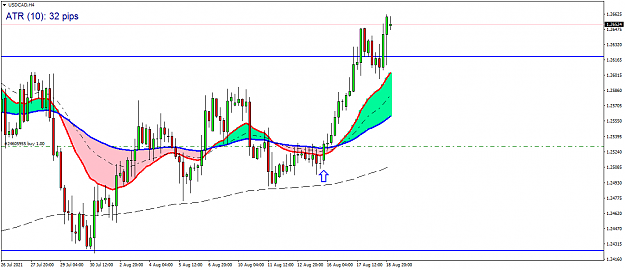
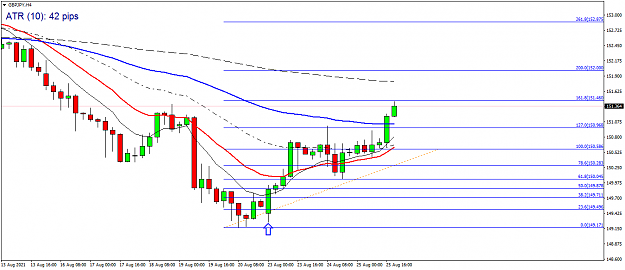
Excellent trade:
BB up
Boss up with a WCC
Worker produced a bullish signal at the bottom of the WCC and middle of strat shadow
Profit taken at top of WCC
Textbook PASR in action
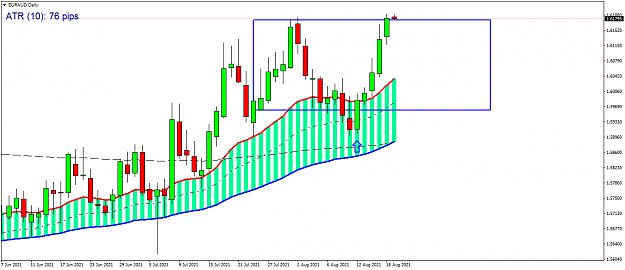
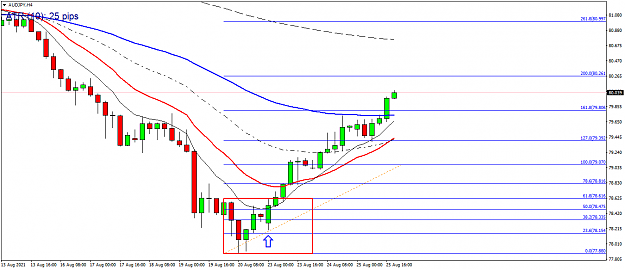
Similar to EURAUD:
BB up
Boss up within WCC
Worker rejection of bottom of WCC and center of shadow
Got long on H4 straddle marked with blue arrow
Better entry would have been at the center of the shadow on worker
Holding position as price has moved through the top of the WCC so no signal to close right now
{quote} Excellent trade: BB up Boss up with a WCC Worker produced a bullish signal at the bottom of the WCC and middle of strat shadow Profit taken at top of WCC Textbook PASR in action Great job Terry {image} {image}
Ignored
thanck you Terry
I am humble from your words
I see in other view markets now thanck to mister Strat and my mentor who make me understand this thread beter and who tell me to come here and study
in your usdcad trade its similar like my euraud but im still unexperience and I prefer no trade when boss its in shadow
I first wait price close outside in direction of big boss
this its in thread somewhere, I know I read it
good trade Terry in usdcad, its go very high, like euraud go if I wasnt close it
Joined Mar 2004
|
Status: Senior Member
|1,634 Posts
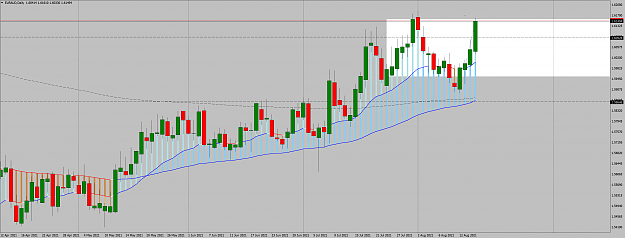
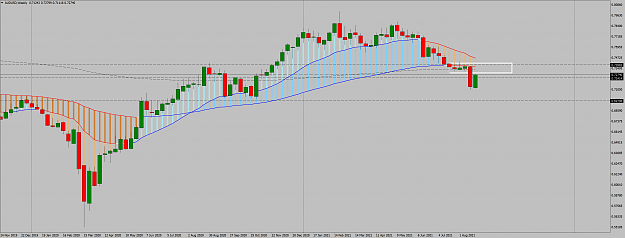
The Strat Swing.
AUD/USD Daily
Doji is the Daily Lowest Low price of last week.
Green horizontal line is the high of that candle. Entry at or just above the line.
Yellow line is the bottom of the WCC .
Similar pattern on many pairs so far this week.
" It don't mean a thing if it ain't got that swing. " Duke Ellington
The Strat Swing. AUD/USD Daily Doji is the Daily Lowest Low price of last week. Green horizontal line is the high of that candle. Entry at or just above the line. Yellow line is the bottom of the WCC . Similar pattern on many pairs so far this week. " It don't mean a thing if it ain't got that swing. " Duke Ellington {image}
Ignored
its not valid wcc because you look at last week and this week candels
this week its only tuesday
wait until its close on friday night and then see if its wcc
{quote} its not valid wcc because you look at last week and this week candels this week its only tuesday wait until its close on friday night and then see if its wcc
Ignored
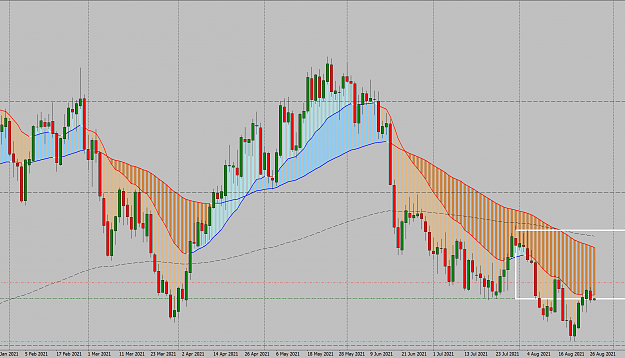
Sorry, I don't think you are calculating correctly.
Go to the daily chart . Last week's days were August 16 to August 20 .
The Doji is August 20 (Friday). It also happened to have the lowest low price of the week.
The WCC was drawn on Saturday, a day after the market closed for the week. Since the Doji low price is also (in this case) the low of the week, the yellow WCC low line is drawn at the Doji low price.
The first green bar is yesterday,,, Monday August 23.
I could have left the WCC low out of the picture. But thought it was interesting that the Doji was also the WCC low which can be an indication of an upcoming swing.
The Strat Swing. AUD/USD Daily Doji is the Daily Lowest Low price of last week. Green horizontal line is the high of that candle. Entry at or just above the line. Yellow line is the bottom of the WCC . Similar pattern on many pairs so far this week. " It don't mean a thing if it ain't got that swing. " Duke Ellington {image}
Ignored
Good stuff Lou,
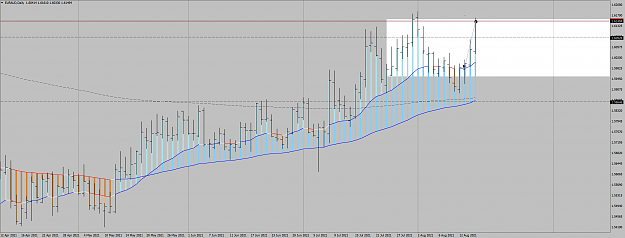
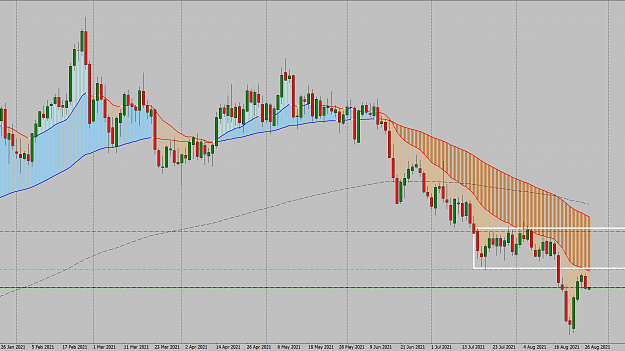
Try adding the 9ema to the chart and once worker candle set up is noted, drop to H4 and enter on a close through its 9ema and trade the H4.
Also if you want to provide a potential target, reverse the BG fib.
{quote} Good stuff Lou, Try adding the 9ema to the chart and once worker candle set up is noted, drop to H4 and enter on a close through its 9ema and trade the H4. Also if you want to provide a potential target, reverse the BG fib. {image}
Ignored
Good afternoon (where I am ) Terry. Yes I have been using the H4 and the BG fib, regular. We are thinking alike.
On the H4 I also use horizontal rectangles defining price areas where it looks to me that the Big Boys are establishing levels. Using them as TP targets and entry points.
Also like how Strat's 41 ema gives me information . Looks like you have it too - - - - - - on your chart.
{quote} Good afternoon (where I am ) Terry. Yes I have been using the H4 and the BG fib, regular. We are thinking alike. On the H4 I also use horizontal rectangles defining price areas where it looks to me that the Big Boys are establishing levels. Using them as TP targets and entry points. Also like how Strat's 41 ema gives me information . Looks like you have it too - - - - - - on your chart. Will look at reverse BG Fib . Appreciate your post.
Ignored
Glad you have settled on one time frame that seems to suit your trading personality.
{quote} Sorry, I don't think you are calculating correctly. Go to the daily chart . Last week's days were August 16 to August 20 . The Doji is August 20 (Friday). It also happened to have the lowest low price of the week. The WCC was drawn on Saturday, a day after the market closed for the week. Since the Doji low price is also (in this case) the low of the week, the yellow WCC low line is drawn at the Doji low price. The first green bar is yesterday,,, Monday August 23. I could have left the WCC low out of the picture. But thought it was interesting...
Ignored
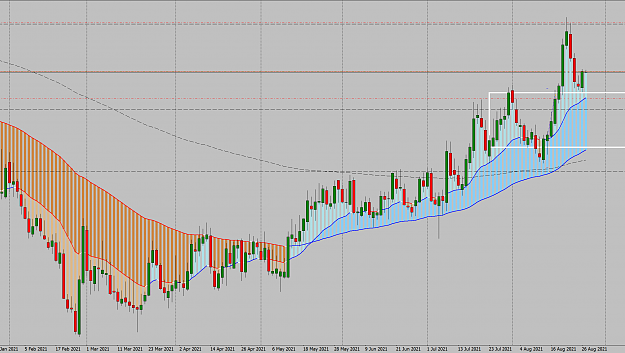
its no wcc Lou
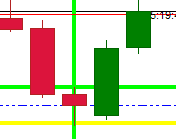
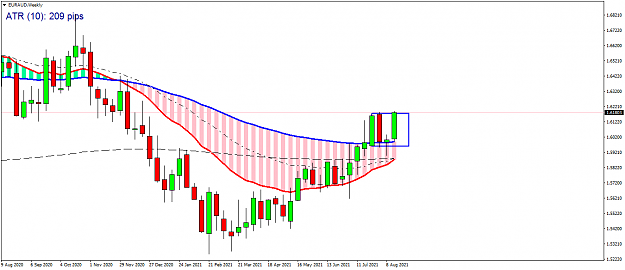
here its my weekly chart
Attached Image (click to enlarge)
red bar its last week
green bar its this week and its not closed, its wednesday now
where you see wcc?
{quote} its no wcc Lou here its my weekly chart {image}red bar its last week green bar its this week and its not closed, its wednesday now where you see wcc?
Ignored
I agree that the Green Candle on the right edge is THIS week's price action that will form the Weekly Candle once it has closed. We cannot make any decision regarding a Weekly Control Candle until it closes on this coming Friday August 27.
We make a WCC decision by analyzing the Weekly Candle range once it has closed.
The Red Candle to it's left is the closed weekly candle from last week. It began on Monday August 16 closed on Friday August 20 . We can analyze the range of that candle to determine if it is a Weekly Control Candle. In this case it is a WCC since it's close is below the range of the previous WCC to it's left.
As I see your chart, you are ignoring the information that last week's August 16 to 20 Weekly Control Candle is providing. You should move your white horizontal lines to the top and bottom of the last week's (red) candle.
{quote} I agree that the Green Candle on the right edge is THIS week's price action that will form the Weekly Candle once it has closed. We cannot make any decision regarding a Weekly Control Candle until it closes on this coming Friday August 27. We make a WCC decision by analyzing the Weekly Candle range once it has closed. The Red Candle to it's left is the closed weekly candle from last week. It began on Monday August 16 closed on Friday August 20 . We can analyze the range of that candle to determine if it is a Weekly Control Candle. In this...
Ignored
Just my two cents, last week's candle closed below recent WCC so that is no longer a WCC. Therefore last week's candle is a potential WCC and is only confirmed at the end of this week.
{quote} Just my two cents, last week's candle closed below recent WCC so that is no longer a WCC. Therefore last week's candle is a potential WCC and is only confirmed at the end of this week. Regards Terry
Ignored
thanck you Terry
I didnt can explain better with my english but you explained good
{quote} I agree that the Green Candle on the right edge is THIS week's price action that will form the Weekly Candle once it has closed. We cannot make any decision regarding a Weekly Control Candle until it closes on this coming Friday August 27. We make a WCC decision by analyzing the Weekly Candle range once it has closed. The Red Candle to it's left is the closed weekly candle from last week. It began on Monday August 16 closed on Friday August 20 . We can analyze the range of that candle to determine if it is a Weekly Control Candle. In this...
Ignored
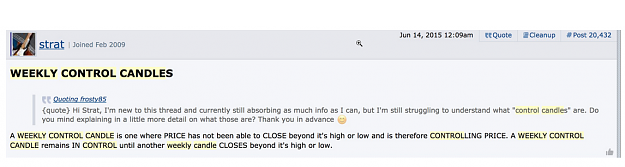
Here is Strat's Post from 2015 describing the WCC
Attached Image (click to enlarge)
In the case we have been discussing, the long red candle is in control since it has closed beyond the last weekly control candle which was one of the spinning top candles where the white lines were drawn on your chart. Thus the red candle is the new WCC and can be used as S/R going forward. It will stop being the WCC when price in an upcoming week has closed beyond it's high or low.