Read charts correctly
Hello dear subscribers,
the new video is online and, as always, you will first receive the English translation. You can find the link from the video at the end of my post.
Many traders spend their lives searching for the holy grail. You dream of recognizing every turning point in advance as possible in order to earn a lot of money with it. In today's post we talk about how a trader is able to read the charts correctly over the long term. An important topic here are the price gaps that we encounter again and again in the chart. With the stock market wisdom that 90% of all price gaps are closed again, traders often get involved in daring trade executions. In today's post we look at the largest gap in EURUSD that has emerged in the last ten years and how traders have reacted to it. At the end we look at an outbreak and how you can clearly identify it beforehand.
In the last 30 years a total of six large price gaps of more than 180 pips have arisen, the last big price gap was in April 2017. Here we see the chart image in the daily chart before the price gap upwards arose. From the trader's point of view, the price was in a downward movement. If we zoom in closer, we notice an extreme downward course, that was the result of the election night between Hillary Clinton and Donald Trump. Many traders have drawn a resistance zone there and when the price got into the zone it was turned down again. The further trend looked just as bearish at first glance. We all know only too well what happened after that. Between April 21 and April 24, 2017, there was a gap of 180 pips. On April 21, the price closed at 1.07220 and opened at around 1.09 on April 24 at 12:00 AM. This means that the market orders were placed on April 21, 2017 shortly before the close. Had that not been the case, the price would have opened at 1.07220 on April 24 and would then have risen sharply. As we know, however, there was a gap in the course. This means that on April 21, shortly before the close, a large number of market buy orders came into the market and at the same time the liquidity of the limit sell orders was very low.
Since the exchange stopped and the market orders were already in the market, the resulting strong upward movement could no longer be executed. If the market had been open for 1 minute longer, the situation would have been as follows. In principle, this price gap can thus be described as a large, strong candle that was triggered by low liquidity in the area of limit orders and, at the same time, a high volume in the area of market orders. After the price gap arose in April 2017, the price went up to 1.255. In total, it took almost three years until the gap was finally closed again. Whether in the end the gap was actually responsible for the fact that the price went down over two and a half years to close it is pure speculation.
What is interesting, however, is the way in which this gap was closed and we will now take a closer look at that. Before the gap was closed completely, the price had already entered the gap twice. We first consider the situation with the yellow arrow. In the second contact phase, I once drew in the Pip values in 4 hours in the H4. You can find some videos about the pip value per minute on my channel. The findings from the yellow square are the most interesting, so let's take a closer look. The higher the value in 4 hours, the stronger the movement up or down. As we can see, the course is in equilibrium here. The big players recognize from this how many long and short traders are in the market at the time. When a price is pushed up, the short traders are stopped and at the same time, with their triggered stops, help drive the market up. When the big players pushed the price up to 438, it was clear that there was a massive number of short traders in the market. Now the market has been pushed down again to motivate more short traders and to stop the long traders. After that, the market slowly went up. Let's look at the situation again with my specially filtered limit orders.
We can see that massive bids were collected in the limit sell orders from February 13th to 17th. From my point of view, the big players actually planned to close the Gap. We also note that on February 18th and 19th, bids continued to be collected even at the low price. On February 20th, the big players realized that the majority of traders had taken a short position because they all expected that the gap would now be closed. The big players take advantage of the situation and now again sold their short position to the willing short traders. Then on February 21st, you push the price up sharply with the help of the short trader's stops. At the high they started collecting ask and after that the price went up a total of 700 pips.
Now the question arises why the course went beyond the gap. To answer this question we have to go back to April 2017 to find the corresponding key candle. We zoom in a little, stay in the daily chart and notice three blue candles that signal a strong downward movement. We draw a zone in this strong downward movement and see which candle breaks through this zone. This is exactly our key candle that will help us plan the next long trade at a later date. Of course you can refine the zone up to the M1 a bit. You can also find information about this on my channel.
We do the same for the second blue candle. We identify the key candle and draw the appropriate zone. Now we come to the third and decisive zone. Interestingly, this key candle was actually the strongest. We now draw this zone and now go into the future. The course went up to 1.25 and then took two and a half years to get exactly into the zone. After that, the price went up from 1.07 to 1.23. Perhaps that should also be a good reason for you in the future to take a closer look at the key candles.
Half a year later the election was in America. On the morning of November 4th, 2020, I carried out a detailed analysis of the election night and published the following post on my blog at Forex Factory. An exciting election night is behind us and at this point in time the winner has not yet been determined. If you compare the price development in November 2016 with the price development last night, from the trader's point of view it looks as if Biden could win the election. We will see which candidate the voters have chosen. In addition to the exciting question of who will win the election, the course in the euro US dollar was much more decisive for me. All in all, it took a few weeks, until it was actually clear that Biden had won the election so easily. Interestingly, the market already knew that beforehand.
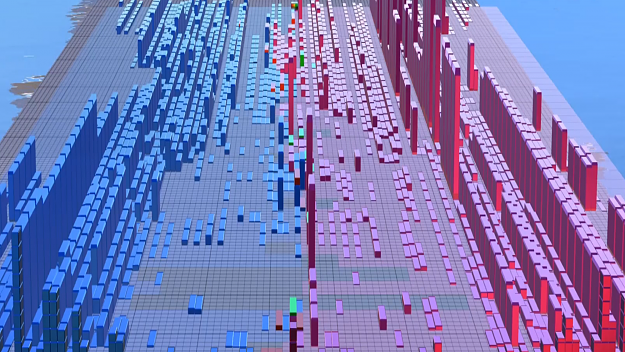
Finally, let's take a look at the outbreak on Wednesday July 28th. First turn your attention to the existing limit orders. There were around 600 limit buy and 600 limit sell orders in the DoM. The big players had collected massive requests in advance and you could see from the stops that the majority of traders were long-oriented. In this respect, the Fed conference was a good opportunity to get these unpleasant long traders out of the market. I also initially expected a somewhat stronger short movement. We look again at the limit orders, which are now around 400 lots on each side. The big players are currently massively withdrawing their limit orders, which speaks for a future breakout. In the middle you can see a bigger box. On the left side we see the strength of the limit buy orders, on the right side the strength of the limit sell orders. And now pay close attention to how suddenly the strength of the limit orders diminishes massively. That's exactly when the outbreak begins. We know exactly that when there is no liquidity in the market, few market orders are able to move the price massively. The big players have used this downward breakout to collect additional Ask at a lower price level. After that, the price was pushed up again and continued to move up over the next few days.
With the help of this information, it is often possible to precisely identify the turning point, even in the smallest units of time. However, you have to be prepared to invest in the appropriate technology and training. In my videos you will find many examples that may motivate you to study the algorithms in more detail in the future. In the next few weeks I have some projects on the program where we will penetrate the market even deeper with very professional programmers. I'll go into that in more detail in my next videos.
First of all, I wish you a nice weekend and continued success in retail.
Kind regards Michael
Attached Image
Hello dear subscribers,
the new video is online and, as always, you will first receive the English translation. You can find the link from the video at the end of my post.
Many traders spend their lives searching for the holy grail. You dream of recognizing every turning point in advance as possible in order to earn a lot of money with it. In today's post we talk about how a trader is able to read the charts correctly over the long term. An important topic here are the price gaps that we encounter again and again in the chart. With the stock market wisdom that 90% of all price gaps are closed again, traders often get involved in daring trade executions. In today's post we look at the largest gap in EURUSD that has emerged in the last ten years and how traders have reacted to it. At the end we look at an outbreak and how you can clearly identify it beforehand.
In the last 30 years a total of six large price gaps of more than 180 pips have arisen, the last big price gap was in April 2017. Here we see the chart image in the daily chart before the price gap upwards arose. From the trader's point of view, the price was in a downward movement. If we zoom in closer, we notice an extreme downward course, that was the result of the election night between Hillary Clinton and Donald Trump. Many traders have drawn a resistance zone there and when the price got into the zone it was turned down again. The further trend looked just as bearish at first glance. We all know only too well what happened after that. Between April 21 and April 24, 2017, there was a gap of 180 pips. On April 21, the price closed at 1.07220 and opened at around 1.09 on April 24 at 12:00 AM. This means that the market orders were placed on April 21, 2017 shortly before the close. Had that not been the case, the price would have opened at 1.07220 on April 24 and would then have risen sharply. As we know, however, there was a gap in the course. This means that on April 21, shortly before the close, a large number of market buy orders came into the market and at the same time the liquidity of the limit sell orders was very low.
Since the exchange stopped and the market orders were already in the market, the resulting strong upward movement could no longer be executed. If the market had been open for 1 minute longer, the situation would have been as follows. In principle, this price gap can thus be described as a large, strong candle that was triggered by low liquidity in the area of limit orders and, at the same time, a high volume in the area of market orders. After the price gap arose in April 2017, the price went up to 1.255. In total, it took almost three years until the gap was finally closed again. Whether in the end the gap was actually responsible for the fact that the price went down over two and a half years to close it is pure speculation.
What is interesting, however, is the way in which this gap was closed and we will now take a closer look at that. Before the gap was closed completely, the price had already entered the gap twice. We first consider the situation with the yellow arrow. In the second contact phase, I once drew in the Pip values in 4 hours in the H4. You can find some videos about the pip value per minute on my channel. The findings from the yellow square are the most interesting, so let's take a closer look. The higher the value in 4 hours, the stronger the movement up or down. As we can see, the course is in equilibrium here. The big players recognize from this how many long and short traders are in the market at the time. When a price is pushed up, the short traders are stopped and at the same time, with their triggered stops, help drive the market up. When the big players pushed the price up to 438, it was clear that there was a massive number of short traders in the market. Now the market has been pushed down again to motivate more short traders and to stop the long traders. After that, the market slowly went up. Let's look at the situation again with my specially filtered limit orders.
We can see that massive bids were collected in the limit sell orders from February 13th to 17th. From my point of view, the big players actually planned to close the Gap. We also note that on February 18th and 19th, bids continued to be collected even at the low price. On February 20th, the big players realized that the majority of traders had taken a short position because they all expected that the gap would now be closed. The big players take advantage of the situation and now again sold their short position to the willing short traders. Then on February 21st, you push the price up sharply with the help of the short trader's stops. At the high they started collecting ask and after that the price went up a total of 700 pips.
Now the question arises why the course went beyond the gap. To answer this question we have to go back to April 2017 to find the corresponding key candle. We zoom in a little, stay in the daily chart and notice three blue candles that signal a strong downward movement. We draw a zone in this strong downward movement and see which candle breaks through this zone. This is exactly our key candle that will help us plan the next long trade at a later date. Of course you can refine the zone up to the M1 a bit. You can also find information about this on my channel.
We do the same for the second blue candle. We identify the key candle and draw the appropriate zone. Now we come to the third and decisive zone. Interestingly, this key candle was actually the strongest. We now draw this zone and now go into the future. The course went up to 1.25 and then took two and a half years to get exactly into the zone. After that, the price went up from 1.07 to 1.23. Perhaps that should also be a good reason for you in the future to take a closer look at the key candles.
Half a year later the election was in America. On the morning of November 4th, 2020, I carried out a detailed analysis of the election night and published the following post on my blog at Forex Factory. An exciting election night is behind us and at this point in time the winner has not yet been determined. If you compare the price development in November 2016 with the price development last night, from the trader's point of view it looks as if Biden could win the election. We will see which candidate the voters have chosen. In addition to the exciting question of who will win the election, the course in the euro US dollar was much more decisive for me. All in all, it took a few weeks, until it was actually clear that Biden had won the election so easily. Interestingly, the market already knew that beforehand.
Finally, let's take a look at the outbreak on Wednesday July 28th. First turn your attention to the existing limit orders. There were around 600 limit buy and 600 limit sell orders in the DoM. The big players had collected massive requests in advance and you could see from the stops that the majority of traders were long-oriented. In this respect, the Fed conference was a good opportunity to get these unpleasant long traders out of the market. I also initially expected a somewhat stronger short movement. We look again at the limit orders, which are now around 400 lots on each side. The big players are currently massively withdrawing their limit orders, which speaks for a future breakout. In the middle you can see a bigger box. On the left side we see the strength of the limit buy orders, on the right side the strength of the limit sell orders. And now pay close attention to how suddenly the strength of the limit orders diminishes massively. That's exactly when the outbreak begins. We know exactly that when there is no liquidity in the market, few market orders are able to move the price massively. The big players have used this downward breakout to collect additional Ask at a lower price level. After that, the price was pushed up again and continued to move up over the next few days.
With the help of this information, it is often possible to precisely identify the turning point, even in the smallest units of time. However, you have to be prepared to invest in the appropriate technology and training. In my videos you will find many examples that may motivate you to study the algorithms in more detail in the future. In the next few weeks I have some projects on the program where we will penetrate the market even deeper with very professional programmers. I'll go into that in more detail in my next videos.
Inserted Video
First of all, I wish you a nice weekend and continued success in retail.
Kind regards Michael
Forget:That does not work, amateurs build the ark, pros the Titanic!
8