distinct price level.
Simplified : highs and lows that have are not still in "debate" (zigzag)
How does it work .
A visual buffer equivalent of the zigzag is maintained but instead of fractals the indicator maintains an evaluation system
-and a memory if you will- into the future of each point of interest (to its right side).
Simultaneously these points of interest are tagged based on their position on the overall trend.
What on earth does that mean ,please explain ,its not only foreign to readers but also search engines.
So ,to simplify further .
- Price moves
- A new high forms ,lets call it hA
- Its valid (not repaint prone)
- Its higher than the previous high
- And thats the second in a row
So ,the Chart Projection indicator stores the price ,the time of hA ,its type (high) ,its alignment to the other highs (higher) and the step of the alignment to the other highs (2) .So hA is a second higher high ,and it wont repaint.
Now the tracking phase begins and the Chart projection indicator measures and averages the moves that ensue after this second higher high.
Bundle a lot of second higher highs together and you can have a simple structure that gives you what usually happens 2 steps in after a 2nd higher high on the
asset the indicator is on .
Now lets say a new 2nd higher high candidate is on the chart (candidate as its very close to the current price action and it cant be validated yet ,we can throw a forecast for it though given enough data ,and if its alignment to the surroundings changes we will update that forecast).
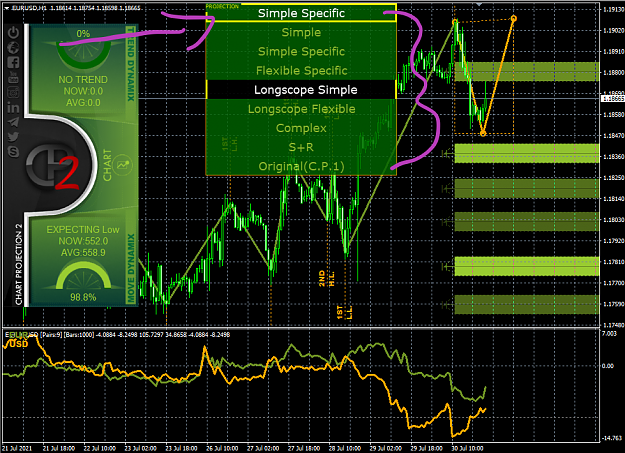
In short thats how projection modes work (all 6 of them) excluding the old CP1 projection ,and the S+R projection ,which uses Support and Resistance levels and the relationship of past price action to them.
Dwight schrute mode on ...
Question : Are these Support and resistance levels -or supply and demand- plotted ? Yes
Question : Can i change projection methods ? Yes
Question : Can i turn off the extra charts and the currency strength because they melt my cpu ? Yes
Question : Theres extra charts and currency strength ? Yes , Renko , Heiken Ashi and data charts resulting from the visual buffer
of the indicator, the currency strength lot operates if the pair is b2in 2 currencies and only plots the pair currencies.
Question : Is there a video i can see eventhough this indicator is totally free ? Yes
Question : Anything wrong with it ? Yes , it can get very slow at times and between timeframe changes
Question : Do you have a telegram channel ,just in case ? Yes https://t.me/lorentzor