Here we goes.
There are people who preach that you should only trade one or two forex pairs. Then you get to know them and you will be much better to take the right trades. I have no doubt that this is right. And some day I will try this approach.
It is also common knowledge, that if you have too many indicators on your chart, then you will not be able to trade. Indicators will tell you different stories and when you finally have decided to take the trade, then it is to late, the train has gone. I also think this is right. But often when I sit with my chart, then I have doubts and would like the oppinion from more indicators than the one or two I have on my chart. This dashboard solves that situation.
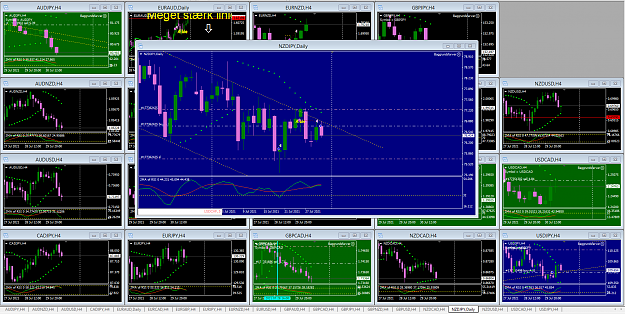
Functionality. Take a look at post #2. At the top there is a chart with buttons on it. That is the Expert Adviser I have made. To be honest, I found it here on FF and added some features.
- When you push one of the buttons then ALL CHARTS on the screen will change to this pair and to the same timeframe.
- The pair you have on the screen has a blue button. Without it you could easily get lost.
- If you own a pair in Long direction, then the button will be green.
- If you own a pair in the short direction, then the button will be red.
- What about the yellow button then?? I will explain that in post 5. It has no function right now.
How I use it.
Half an hour before the 4H bar ends, I go through all the pairs, clicking my way on the menu buttons. When I click on a button, it shows a new pair. If the pair looks interesting, then I take a look at all the indicator charts in order to decide if there is a possible trade. But mostly the pair is not of interest at the given moment and I move on to the next pair of the menu.
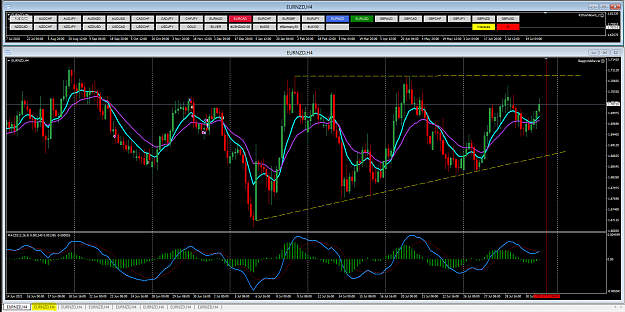
I have for the time being 7 charts on my screen. When I push a button, they will all get the same pair and the same time frame. Each of the charts have a different setup of indicators. When I open one of the charts, it will open in the large chart, that you can see on the picture in post #2. In this case it is EURNZD which is now on all the charts on the screen.
On the first chart (which is marked with a yellow pen) I have indicators for moving average cross and MACD.
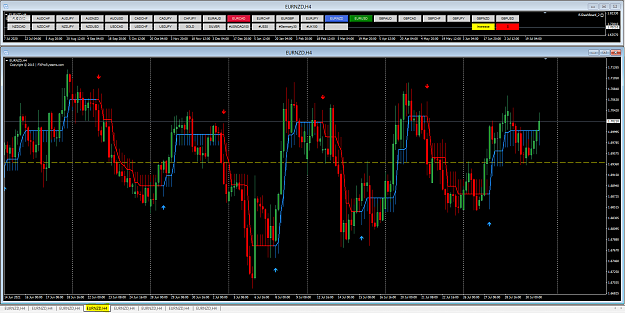
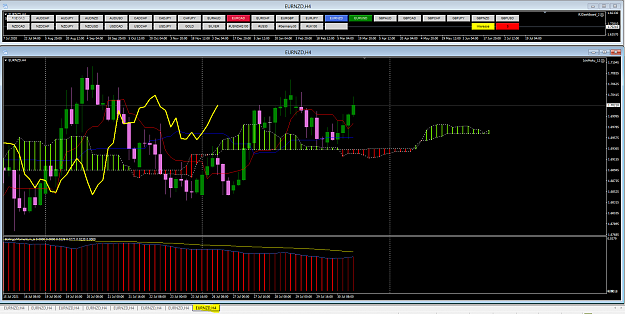
The third chart contain the Halftrend indicator. And the seventh chart contain the Ichi Moku situation. See post #3
The thing is - You can have as many charts as you like and you decide your self which indicators you will have on the screen. Maybe you are following a strategy you found on Youtube or here at FF. Just make a chart with that strategy. A good thing is, that it does not take much computer power for each chart. There are some draw backs. I will describe them in post #4.
I allways take my trading signals from timeframe 4 hours. I might find the entry point on a lower time frame, but that is not a part of this story. Using H4 gives nice clean charts and I have all the time in the world to analyze the situation.
I trade 20 Forex pairs. I do not trade the CHF pairs, because they often have to high a split. I take a look at the situation half an hour before end of the current bar. When the bar ends, I take the trades - if any and I make corrections on existing pairs that I own. Like trailing the stop etc.
In post #3 I will upload a couple of examles.
In post #4 I will describe some drawbacks.
In Post #5 I will describe the future of this Expert Adviser.
The posts 1 to 7 will be updated whenever I think of something important, so even if you have read them, then read them again after a while.
Here is the EA and the template. After installing you must make the charts you want with the trading systems you want. Then shifting through the systems is easy with this EA.