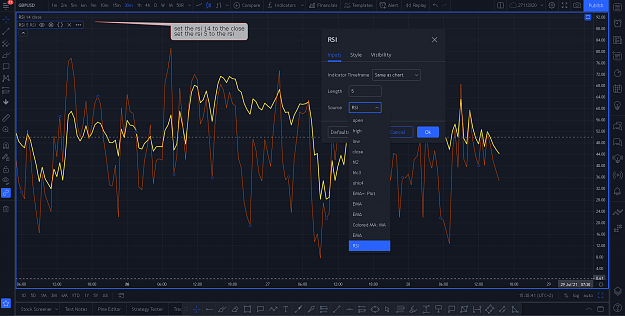
If you have done this correctly you should now have a completely white chart with only the current price line showing. Next we are going to add the average which is a 26 period EMA as a double thickness black line So open the navigator select Moving Averages and set the parameters like this... {image}
This is an excellent interpretation of chart reading and written chart comments.
I would strongly advise newbies to do exactly the same thing on a daily basis because it serves to get your mind in the zone and realize how price action flows and how we can respond to it making nice consistent profits.
{quote} hi huskyboy, Could you please explain some terms and acronyms. What is 'bus', 'bed', 'rrbud', 'rrbed' ? Thank you very much
Ignored
thought everyone would understand, my mistake. Like Alan already mentioned :
- bud : regular bull divergence
- bed : regular bear divergence
- rrbud : rsi/rsi bull divergence
- rrbed : rsi/rsi bear divergence
- bus : bull support
- bes : bear support
- hd : hidden divergence
- 2bt : 2 bar test
and those not on that chart (cause i knew that these aren't so obvious)
- bust : bull strenght
- best : bear strenght
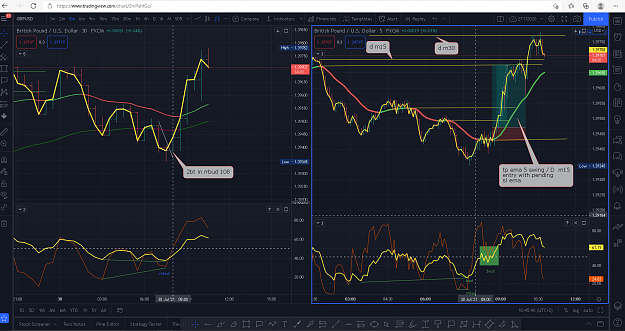
It would appear to me you use the 30 min and the 15 min quite a bit whereas I use the 60 min and 5 min mostly but that is only a minor thing.
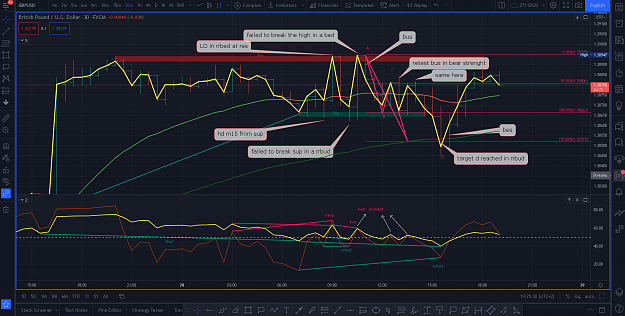
I don't even have a 30 min chart but I can see stuff well enough on yours. Check out all the fast RSI pushes below the waterline where the slow remains above, these are what I refer to as bears oversold (beos) but look where they then push up again and fail to cross the slow RSI, this is what I refer to as bull weakness (buwk). So by applying two bar tests on both these fast lows and highs we can score more pips.
There is an obvious bed at the very top and it would appear it has been tested with the hook (h) so it may well test the EMA now.
So this adds quite a few more acronyms to the list. Good job (HB), there's another acronym
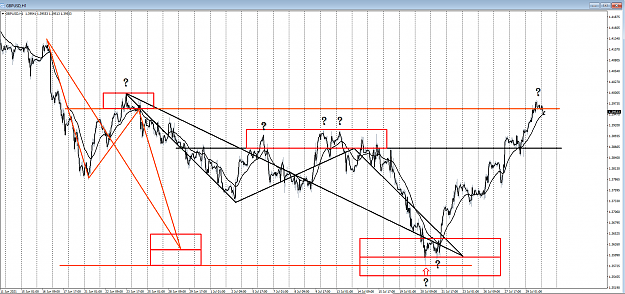
Here is another 1 hour chart I use just to draw on, no RSI.
It takes quite a few days to complete these moves so I don't want to add the clutter to my main chart. I have cleaned the chart up a tad to make things clearer.
What we are looking at here is two AB = CD's with their plus or minus (red boxes) from the 50% levels.
You can see where I am asking myself questions, i.e. ZOO points. There are many more questions asked but these were on other charts.
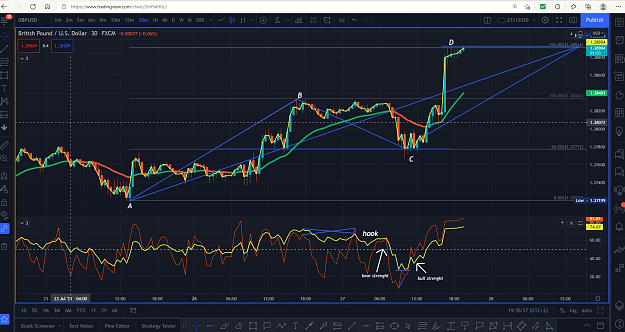
Here is another 1 hour chart I use just to draw on, no RSI. It takes quite a few days to complete these moves so I don't want to add the clutter to my main chart. I have cleaned the chart up a tad to make things clearer. What we are looking at here is two AB = CD's with their plus or minus (red boxes) from the 50% levels. You can see where I am asking myself questions, i.e. ZOO points. There are many more questions asked but these were on other charts. {image}
Ignored
Hi mentor, what is the concept of plus and minus? pleas explain
{quote} Hi mentor, what is the concept of plus and minus? pleas explain
Ignored
AB is the move we are measuring.
C is the 50% return of the move.
We measure CD to equal AB
Now is not always exactly on the 50% sometimes a tad more and sometimes a tad less so we measure this difference and allow for it when making the target D.
{quote} AB is the move we are measuring. C is the 50% return of the move. We measure CD to equal AB Now is not always exactly on the 50% sometimes a tad more and sometimes a tad less so we measure this difference and allow for it when making the target D.
Ignored
when return of the move is more than 50% we minus those extra pips and when D formed we add them in D ?