RSI by Highs and Lows
The Relative Strength Index (RSI) measures the price forces in one direction or the other by comparing consecutive close prices. As bars close higher, the RSI increases; as bars close lower, the RSI decreases.
The common interpretation says that RSI values above 70 means we deal with an overbought asset and values below 30 means we deal with an oversold asset.
The problem with comparisons between consecutive close prices is that sometimes they aren't really important. There are scenarios where a bar closes above or below the previous one, not being this the most remarkable aspect between those two consecutive bars.
What if the bar closes below the previous one but the high price was considerably higher than the previous one? I will be honest with all of you. A higher high is really more important to me. The same logic applies when we have a close price above the previous one but with a new lower low.
This makes me think that an alternative to this approach of measuring price strength where highs and lows played a key role will benefit some traders. I thought about it and made the calculation below explained. This approach removes close prices from the equation.
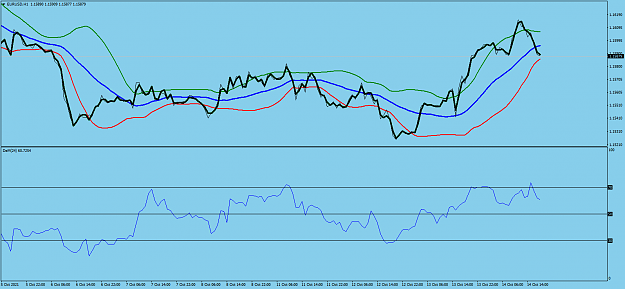
And here is where RSI by Highs and Lows (RSI HL) comes handy. For those who think that highs and lows matter, RSI HL is an alternative to a simple RSI for measuring price forces. Also, it is usually faster at the time to reach overbought and oversold zones. For those who use RSI to anticipate trend reversals due to its momentum intentions, instead of reducing the RSI period, you may give the RSI HL a try.
Calculation
High Gain = High - High Previous
If High Gain is below 0, then High Gain = 0
Low Decline = Low Previous - Low
If Low Decline is below 0, then Low Gain = 0
If High Gain is greater than Low Decline, then Low Decline = 0,
else if Low Decline is greater than High Gain, then High Gain = 0
Period = 14
Average Highs Gain = Summation of the last 14 High Gains / 14
Average Lows Decline = Summation of the last 14 Low Declines / 14
RSI HL = 100 - (100 / (1 + Average Highs Gain / Average Lows Decline))
MetaTrader 4/5 Indicators
Attached File(s)
Attached File(s)
Algos Coder