• Home
  • Forums
  • Trades
  • News
  • Calendar
  • Market
  • Brokers
  • Login
  • Join
  • User/Email: Password:
  • 2:59am
Menu
  • Forums
  • Trades
  • News
  • Calendar
  • Market
  • Brokers
  • Login
  • Join
  • 2:59am
Sister Sites
  • Metals Mine
  • Energy EXCH
  • Crypto Craft

Options

Bookmark Thread

First Page First Unread Last Page Last Post

Print Thread

Similar Threads

Help identifying the indicator 6 replies

Help identifying this indicator to search for the mq4 file 0 replies

MT4 Trade Condition Indicator/Dashboard 22 replies

Condition Identifier Indicator? 7 replies

Identifying Ranging Markets 8 replies

  • Platform Tech
  • /
  • Reply to Thread
  • Subscribe
  • 22
Attachments: Indicator for identifying ranging condition
Exit Attachments

Indicator for identifying ranging condition

  • Last Post
  •  
  • Page 1 234 5
  • Page 1 234 5
  •  
  • Post #1
  • Quote
  • First Post: Edited Jul 10, 2021 9:29pm Jul 6, 2021 9:10am | Edited Jul 10, 2021 9:29pm
  •  RiskFighter
  • Joined Jun 2017 | Status: Robot coder, Trade for a living. | 357 Posts
I saw an indicator on Tradingview the other day. I want to keep my MT4, because it is better in so many ways, so I had to programme the indicator for MT4.

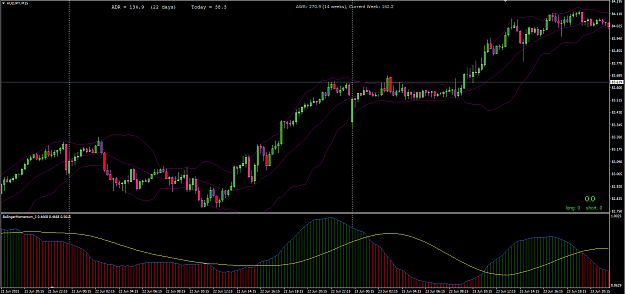
The biggest problem we have as traders are - when is the chart ranging and when is it trending. There are many ways to find the information, but I don't have the perfect way. I have allways thought, that the Bollinger Indicator is one of the best indicators for the purpose, but it can be quit messy and it can be difficult to sort out the view in a glance. So I made this indicator which I think is smart. Don't know if it exists for MT4 allready - probably does, I just haven't come across it.

It is very simple. The indicator looks x bars back using the Bollinger formula. It meassure the distance between upper and lower band. This distance is defined by John Bollinger as a meassure of trending conditions. If the distance is big, then the chart is trending. If it is small, then the chart is in a range.

So my indicator sums the distance between the two bands at x bars behind and the divide the result by the number of bars. This gives you a simple average of the condition.

I only finished the coding right now and hasn't really played around with the indicator. But as allways when you use an indicator, it is important to play with the settings. There are only one setting for now. That is the number of bars the indicator shall operate. MA_Length. I find that if you set the value to twice the bars in the Bollinger indicator, then you have less noise. I will show the indicator in the next thread. Have a little patience please.

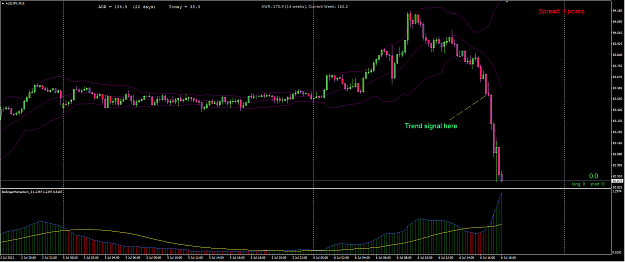
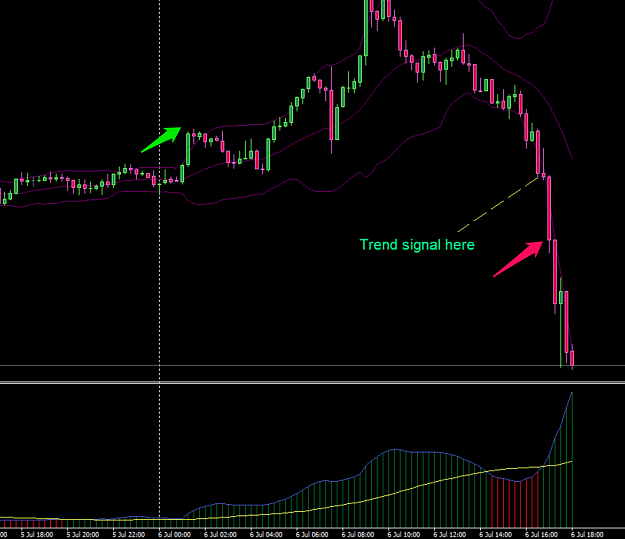
Keep in mind, that this indicator is lacking. It cannot tell you for certain anything about the future. But I am a fan of the saying "whatever the chart is doing - it want to continue doing just that".
Read post #1 !! Then read it again 10 more times before you ask.
  • Post #2
  • Quote
  • Edited at 1:41pm Jul 6, 2021 9:14am | Edited at 1:41pm
  •  RiskFighter
  • Joined Jun 2017 | Status: Robot coder, Trade for a living. | 357 Posts
So here is the chart. When the yellow line goes over the red histogram, then the condition is ranging and when it goes under the green histogram the condition is beginning to trend. I think that the indicator can be a helping hand when deciding entry point, but it is not the best at deciding the exit point.

At the chart I have the Bollinger indicator with a setting of 20,2. And my momentum indicator has a setting of 40.
Attached Image (click to enlarge)
Click to Enlarge

Name: 2e8b160ada483dbbcd41f8a2505b3450.png
Size: 44 KB
Read post #1 !! Then read it again 10 more times before you ask.
 
6
  • Post #3
  • Quote
  • Jul 6, 2021 9:16am Jul 6, 2021 9:16am
  •  RiskFighter
  • Joined Jun 2017 | Status: Robot coder, Trade for a living. | 357 Posts
Attached File
File Type: ex4 BollingerMomentum_3.ex4   8 KB | 468 downloads
Attached File
File Type: mq4 BollingerMomentum_3.mq4   5 KB | 644 downloads
Read post #1 !! Then read it again 10 more times before you ask.
 
11
  • Post #4
  • Quote
  • Jul 6, 2021 9:18am Jul 6, 2021 9:18am
  •  feast
  • | Joined Jul 2018 | Status: Member | 43 Posts
Quoting RiskFighter
Disliked
So here is the chart. When the yellow line goes below the histogram, then the condition is ranging and when it goes over the histogram the condition is beginning to trend. I think that the indicator can be a helping hand when deciding entry point, but it is not the best at deciding the exit point. At the chart I have the Bollinger indicator with a setting of 20,2. And my momentum indicator has a setting of 40. {image}
Ignored
Do you mean it ranges when yellow line goes above the histogram?
 
1
  • Post #5
  • Quote
  • Jul 6, 2021 9:38am Jul 6, 2021 9:38am
  •  Drolph
  • Joined Jun 2015 | Status: Member | 696 Posts | Online Now
Very fine piece of work, RiskFighter!
 
1
  • Post #6
  • Quote
  • Jul 6, 2021 10:00am Jul 6, 2021 10:00am
  •  RiskFighter
  • Joined Jun 2017 | Status: Robot coder, Trade for a living. | 357 Posts
Quoting feast
Disliked
{quote} Do you mean it ranges when yellow line goes above the histogram?
Ignored
When yellow line is over the red histogram, then it ranges.
Read post #1 !! Then read it again 10 more times before you ask.
 
 
  • Post #7
  • Quote
  • Jul 6, 2021 10:00am Jul 6, 2021 10:00am
  •  RiskFighter
  • Joined Jun 2017 | Status: Robot coder, Trade for a living. | 357 Posts
Quoting Drolph
Disliked
Very fine piece of work, RiskFighter!
Ignored
Thank you Drolph. I have missed this tool allways.
Read post #1 !! Then read it again 10 more times before you ask.
 
 
  • Post #8
  • Quote
  • Jul 6, 2021 11:02am Jul 6, 2021 11:02am
  •  RiskFighter
  • Joined Jun 2017 | Status: Robot coder, Trade for a living. | 357 Posts
Thank you Admin for moving the thread to a correct position!
Read post #1 !! Then read it again 10 more times before you ask.
 
 
  • Post #9
  • Quote
  • Jul 6, 2021 11:13am Jul 6, 2021 11:13am
  •  RiskFighter
  • Joined Jun 2017 | Status: Robot coder, Trade for a living. | 357 Posts
Look at this!!! I still haven't played with it. This is just the pair that I have open while programming the indicator. 68 pips in 1.5 hours.

Thank you John Bollinger. You are tremendous.
Attached Image (click to enlarge)
Click to Enlarge

Name: 08a54dbfe938bf2f44d30efb3992df57.png
Size: 42 KB
Read post #1 !! Then read it again 10 more times before you ask.
 
4
  • Post #10
  • Quote
  • Edited at 11:44am Jul 6, 2021 11:17am | Edited at 11:44am
  •  RiskFighter
  • Joined Jun 2017 | Status: Robot coder, Trade for a living. | 357 Posts
I hereby challenge you all.

  1. How can this indicator be used for entry. What should be the additional signs of entry?
  2. Which is the best way to exit the trade. Giving the highest average profit?
  3. Is it better for higher timeframes with less faulties?

Please note, that the indicator does not give any hint of the direction of the market - nothing. Only if it is ranging or trending.

Also note, that if the market is trending, and the direction is shifting from say Short into Long, then the histogram can be green both before and after the change if the trend in the new direction is still strong. This can be hard to understand, but it really is positive that you get the signal, that when trend is changing, then it is a strong trend.

Read post #1 !! Then read it again 10 more times before you ask.
 
1
  • Post #11
  • Quote
  • Jul 6, 2021 11:44am Jul 6, 2021 11:44am
  •  ryuryu
  • Joined Apr 2020 | Status: Member | 1,381 Posts
Very interesting!

But please tell me may be I'm wrong

Attached Image (click to enlarge)
Click to Enlarge

Name: e83a4efa4c746a0b1aeed8232728017a.png
Size: 112 KB

First entry because histogram was > yellow line & close > upper BB
Second because > too & close < lower BB

Or I miss smth?

p.s. the idea to count distance is extremely good. I'm using about the same approach but not with BB, but the main idea is the same.
Observer effect
 
1
  • Post #12
  • Quote
  • Jul 6, 2021 11:57am Jul 6, 2021 11:57am
  •  RiskFighter
  • Joined Jun 2017 | Status: Robot coder, Trade for a living. | 357 Posts
Quoting ryuryu
Disliked
Very interesting! But please tell me may be I'm wrong {image} First entry because histogram was > yellow line & close > upper BB Second because > too & close < lower BB Or I miss smth? p.s. the idea to count distance is extremely good. I'm using about the same approach but not with BB, but the main idea is the same.
Ignored
Yes you are wrong.

1: The first signal you point out, is not a signal from my indicator. Look at the green bars. My indicator sets the signal way before.
2: My indicator does not take into conciderence if the signal is over or below any line. It is the distance between upper band and lower band that is the input to the indicator. A large distance gives a trend. A small distance gives a range. Easy.

It is not my invention. John Bollinger made the theory. But I think that my indicator gives a better glance for reaction than the normal Bollinger Band.
Read post #1 !! Then read it again 10 more times before you ask.
 
1
  • Post #13
  • Quote
  • Jul 6, 2021 11:59am Jul 6, 2021 11:59am
  •  Glorybound
  • | Joined Nov 2020 | Status: Member | 356 Posts
Quoting RiskFighter
Disliked
{file}{file}
Ignored
Thank you for this great work. Please how do we add them to the charts?
I tried my usual way - to my indicator list but they are not showing!
 
 
  • Post #14
  • Quote
  • Jul 6, 2021 12:02pm Jul 6, 2021 12:02pm
  •  ryuryu
  • Joined Apr 2020 | Status: Member | 1,381 Posts
Quoting RiskFighter
Disliked
{quote} Yes you are wrong. 1: The first signal you point out, is not a signal from my indicator. Look at the green bars. My indicator sets the signal way before. 2: My indicator does not take into conciderence if the signal is over or below any line. It is the distance between upper band and lower band that is the input to the indicator. A large distance gives a trend. A small distance gives a range. Easy. It is not my invention. John Bollinger made the theory. But I think that my indicator gives a better glance for reaction than the normal Bollinger...
Ignored
You asked

  1. How can this indicator be used for entry. What should be the additional signs of entry?

Didn't get your answer, but no problem. Anyway your research is very promising! Stay green!

Observer effect
 
 
  • Post #15
  • Quote
  • Jul 6, 2021 12:06pm Jul 6, 2021 12:06pm
  •  HimmerJimmer
  • | Joined May 2021 | Status: Member | 72 Posts
Thanks for this. It's a great one. Many uses to use for this indi. I've immediately found it improved my system by acting as a volume/volatility filter. I'm going to test further but it could also be used as a possible confirmation indicator as well. Anyway, good indicator and thanks for sharing
You gotta boop the snoot
Super Scalper Test pt3 (D.T.) Return This Week: na
 
1
  • Post #16
  • Quote
  • Jul 6, 2021 1:24pm Jul 6, 2021 1:24pm
  •  RiskFighter
  • Joined Jun 2017 | Status: Robot coder, Trade for a living. | 357 Posts
Quoting Glorybound
Disliked
{quote} Thank you for this great work. Please how do we add them to the charts? I tried my usual way - to my indicator list but they are not showing!
Ignored
Well, I add it as usual to the directory of indicators. No problem at my end. Did you remember to refresh?? Right click on the heading "Indicators" and click on refresh.

Anybody else having a problem??
Read post #1 !! Then read it again 10 more times before you ask.
 
 
  • Post #17
  • Quote
  • Jul 6, 2021 1:28pm Jul 6, 2021 1:28pm
  •  RiskFighter
  • Joined Jun 2017 | Status: Robot coder, Trade for a living. | 357 Posts
Quoting Matteorossi
Disliked
{quote} RF, you said "... and when it goes over the histogram the condition is beginning to trend". I think the right sentence is " when it goes over the GREEN histogram the condition is beginning to trend."
Ignored
No. When the yellow line goes over the red histogram, it ranges.
When the line goes under the green histogram it is trending.
Read post #1 !! Then read it again 10 more times before you ask.
 
 
  • Post #18
  • Quote
  • Jul 6, 2021 2:33pm Jul 6, 2021 2:33pm
  •  dr.butze
  • | Joined Jun 2020 | Status: Member | 156 Posts
Dear @RiskFighter , thanks for the great suggestion and your indicator that we can all use the idea. I have a question about this. When the histogram turns green, is there a difference if the yellow line touches the green bars or not? By that I mean is there any difference if the yellow line is above or below the green bar.
Thank you very much.
Regards
 
 
  • Post #19
  • Quote
  • Jul 6, 2021 2:38pm Jul 6, 2021 2:38pm
  •  RiskFighter
  • Joined Jun 2017 | Status: Robot coder, Trade for a living. | 357 Posts
Quoting dr.butze
Disliked
Dear @RiskFighter , thanks for the great suggestion and your indicator that we can all use the idea. I have a question about this. When the histogram turns green, is there a difference if the yellow line touches the green bars or not? By that I mean is there any difference if the yellow line is above or below the green bar. Thank you very much. Regards
Ignored
Well, you can look at it in two ways. The other way is using the histogram. Forget the line. If the histogram is red, then it is ranging. If the histogram is green, then it is trending.

The indicator does NOT know which direction it is trending. You have to find the direction using something else.
Read post #1 !! Then read it again 10 more times before you ask.
 
 
  • Post #20
  • Quote
  • Jul 6, 2021 3:01pm Jul 6, 2021 3:01pm
  •  dr.butze
  • | Joined Jun 2020 | Status: Member | 156 Posts
Quoting RiskFighter
Disliked
{quote} Well, you can look at it in two ways. The other way is using the histogram. Forget the line. If the histogram is red, then it is ranging. If the histogram is green, then it is trending. The indicator does NOT know which direction it is trending. You have to find the direction using something else.
Ignored
Thank you very much.
I was aware that the direction is unknown and it is only about the distance. However, the function of the 40 MA was unclear to me
 
 
  • Platform Tech
  • /
  • Indicator for identifying ranging condition
  • Reply to Thread
    • Page 1 234 5
    • Page 1 234 5
0 traders viewing now
  • More
Top of Page
Forex Factory Blog Updated: Alerting All Members
  • Facebook
  • Twitter
About FF
  • Mission
  • Products
  • User Guide
  • Media Kit
  • Blog
  • Contact
FF Products
  • Forums
  • Trades
  • Calendar
  • News
  • Market
  • Brokers
  • Trade Explorer
FF Website
  • Homepage
  • Search
  • Members
  • Report a Bug
Follow FF
  • Facebook
  • Twitter

FF Sister Sites:

  • Metals Mine
  • Energy EXCH
  • Crypto Craft

Forex Factory® is a brand of Fair Economy, Inc.

Terms of Service / ©2022