First off... Don't confuse confidence with competence.
Confidence is very much a traders enemy because it relates to our thoughts and we simply cannot think trades. The market has no idea at all what we have on our minds and many books (making the authors very wealthy) have been written under the heading of this trading psychology. Does it help to read this stuff... I 'think' not.
I am never confident that my trade is going to work but I am certainly hopeful it will do so. However hope does not pay the bills so I have to have an edge up my sleeve to force a desired outcome.
When we force a desired outcome we are using our competence We master our tools and muscle memory kicks in rather than thought. We start with a tentative entry based upon a signal being given where we would expect one to be. No signal no trade. We have an expectation price is trying to reach a certain level so we add to our position and move our stops accordingly. We also have an expectation of the reward we desire and thus hold until we achieve this result. Taking less is just quitting and this too can become habit forming.
Get on the right side of good habits even if this means the odd profits are given back through holding too long. Remember you have the option to hedge the trade if in doubt thus locking in your profits.
I am not a psychologist and try not to get involved with all that stuff, if I get stopped out so be it, the loss is only small.
I cannot comment on your mindset because we occupy a different space and probably see different things on our charts. If you practice the concepts until they become mechanical then thinking trades goes out the window replaced by the competence you have in your trading.
PS The last version was much longer so I chopped it back somewhat.
{quote} First off... Don't confuse confidence with competence. Confidence is very much a traders enemy because it relates to our thoughts and we simply cannot think trades. The market has no idea at all what we have on our minds and many books (making the authors very wealthy) have been written under the heading of this trading psychology. Does it help to read this stuff... I 'think' not. I am never confident that my trade is going to work but I am certainly hopeful it will do so. However hope does not pay the bills so I have to have an edge up...
Ignored
really helpfull and i am looking for this type of explanation, i have to master my tools and become more competent, thank you mentor
Here below on the 1 hour chart I have the main stuff I am looking for. There is a bit more but even with this small print it is hard to fit it on a single chart.
So...
1) we see a signal at a ZOO and take a punt on a tentative trade using the lower time frame to better manage our entry and stop.
2) If the signal was a div then watch out for the retest i.e. the dreaded HOOK
3) Consider the target distance both for the price and the EMA
4) Load trades to make the required profit in a reasonable distance/time.
5) Rinse and repeat
Keep it all very simple like this and mark the charts with these similar labels and you will quickly get a handle on what price action is doing.
Attached Image (click to enlarge)
The story is almost always the same day in day out so no signal no trade. I have a saying 'Quote" If nothing changes it remains the same. So if there is no signal then price may still be working on an older one. It does have to get it all done in one day, sometimes many months are involved in the major moves.
Here below on the 1 hour chart I have the main stuff I am looking for. There is a bit more but even with this small print it is hard to fit it on a single chart. So... 1) we see a signal at a ZOO and take a punt on a tentative trade using the lower time frame to better manage our entry and stop. 2) If the signal was a div then watch out for the retest i.e. the dreaded HOOK 3) Consider the target distance both for the price and the EMA 4) Load trades to make the required profit in a reasonable distance/time. 5) Rinse and repeat Keep it all very simple...
Ignored
Hi Alan,
This is brilliant, thanks for pulling this together, its so much easier for me to understand when I can see a chart with your comments attached. If its not too much trouble could I ask how you identify the "dreaded hook" as you call it. I noticed its not always the 1st pull back after the div but I cannot see from the chart how you identify these. I would have gone for the 1st pull back and hence missed them. Any help gratefully appreciated
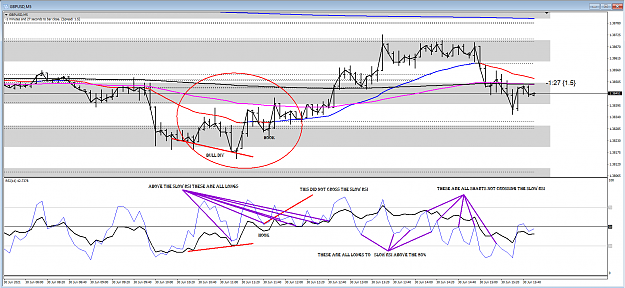
Yes Des perhaps the chart below will make things a tad clearer. See how we can get information from the two speed RSI's {image} I use this info a lot to add to positions.
Ignored
Thanks Alan,
great insight, will certainly add to arsenal of things to consider when adding to a trade. Also like the inference from the Daily/Higher Time Frame
As I awake the EMA on the hour did make the expected LL but it seems to be struggling a tad here. Price has not yet made the next swing low so I would be cautious here and watch for a cross back north of the EMA. We did get a bull div sending price back to the EMA but no closing cross and as such no bull support as yet.
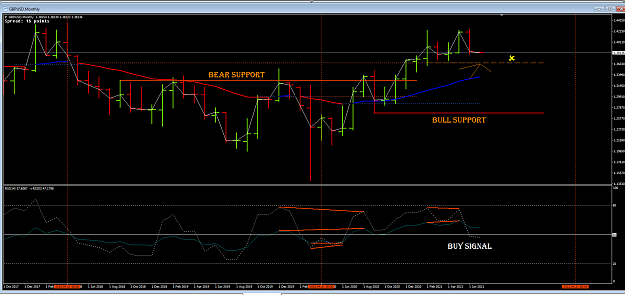
Now today is the 1st of the month so checking the monthly chart we see the RSI closed in a bull signal, however don't get too excited over this because the tails on a monthly chart can be huge in regards to pips. So it is just something to have in mind since the monthly EMA is still trying to make the HH (X).
We can also use this two speed for an inference on the daily chart. {image}Look for lower time frame signals to got in the desired direction
Ignored
Hi alan, i don't understand it clearly the buy and sell , there is no divergence on every buy sell only some have divergences. What is the concept behind these entries and how we take them as inference for entries on smaller time frame?
Thank you for your patience
{quote} Hi alan, i don't understand it clearly the buy and sell , there is no divergence on every buy sell only some have divergences. What is the concept behind these entries and how we take them as inference for entries on smaller time frame? Thank you for your patience
Ignored
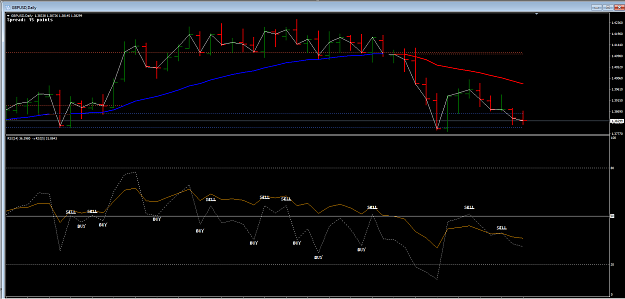
Divergence is not the be all of trading but it makes for a nice start.
Above we are comparing the RSI's looking for current weakness or overly strong in the fast RSI.
Look at the relationship with the two RSI's in relative to the 50% waterline which is in turn the EMA. If the fast crosses but the slow doesn't then we have an overly strong signal.
If the fast RSI cannot cross the slow RSI then we have weakness and trade it accordingly.
{quote} Divergence is not the be all of trading but it makes for a nice start. Above we are comparing the RSI's looking for current weakness or overly strong in the fast RSI. Look at the relationship with the two RSI's in relative to the 50% waterline which is in turn the EMA. If the fast crosses but the slow doesn't then we have an overly strong signal. If the fast RSI cannot cross the slow RSI then we have weakness and trade it accordingly.
Ignored
what is the meaning of strong and weakness of rsi, sorry if the question is so basic, and how we get the idea of buy and sell?
{quote} what is the meaning of strong and weakness of rsi, sorry if the question is so basic, and how we get the idea of buy and sell?
Ignored
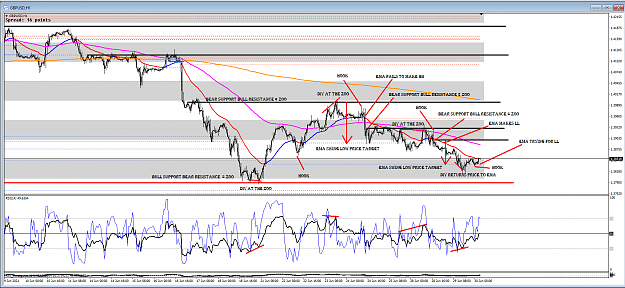
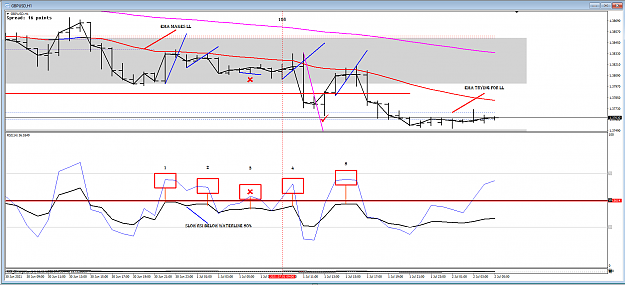
OK Yahya let's take these bear signals.
Observe the chart is showing we are trading below the average indicated both on the price chart and the RSI being below the 50% level (highlighted red)
Now look at the red boxes showing where the fast RSI has pushed above the 50% leaving the slow (black) RSI below the line.
These are clues to short the market so we do our two bar tests (Blue)
Note during the Asian market there was not much movement but we could have scalped a few pips.
Look at box 3 we could not two bar test it so we would not take it.
Once we reached the 108 bar things started to pick up and boxes 4 and 5 proved to be nice runners.
So we have timing and we have signals and we would be targeting price making the average swing low. Box 4 did the deed and made 66 pips.
Put this together and you have a decent trading plan.
{quote} OK Yahya let's take these bear signals. Observe the chart is showing we are trading below the average indicated both on the price chart and the RSI being below the 50% level (highlighted red) Now look at the red boxes showing where the fast RSI has pushed above the 50% leaving the slow (black) RSI below the line. These are clues to short the market so we do our two bar tests (Blue) Note during the Asian market there was not much movement but we could have scalped a few pips. Look at box 3 we could not two bar test it so we would not take...
Ignored
This is Truely incredible explanation mentor, i fully understand the concept and now it is much easier to get inference from higher time frames, before this i thought only divergence (on higher time frame also) is suitable for entries. Thank you so much for this detailed explanation
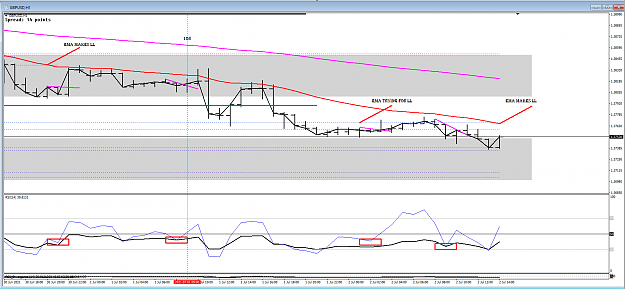
Now the above were the bear moves but the bulls also have their say. Since we are trading down we need to consider where to hedge our shorts' Look at this same 1 hour chart with the bull signal red boxes. We see the fast RSI fails to close across the slow RSI. So once again we apply the two bar test at these points and protect our short trades with a hedge and collect a few pips for our trouble. Not forgetting the all important stops....{image}Don't forget the NFP tonight, I don't trade it because the spreads widen too much for me to be interested....
Ignored
I make my notes , very nice explanation as always , Thanks dear Alan , one more thing it is necessary to apply two bar test ? every time?
{quote} I make my notes , very nice explanation as always , Thanks dear Alan , one more thing it is necessary to apply two bar test ? every time?
Ignored
Yes apply every time. The more accurate issue is when to enter when applying the 2 bar test. If you enter while the candle you are testing is active. This is more risky as price can go the other way. But there are are exceptions to the rule if you start getting an engulfing candle maybe u should stick in a trade with a tight stop loss.
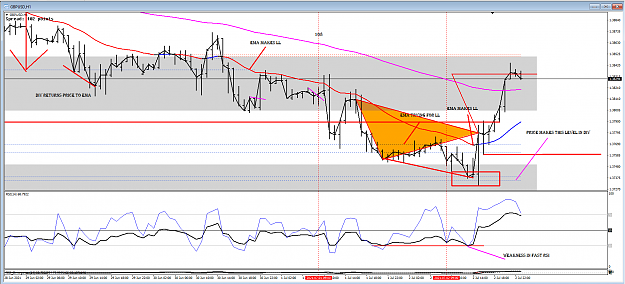
Even with 2 bar test, divs don't always work. Like today, hardly any of the divs crosses ema and went to test the other side until the 1hour reached LL. Which happened near the time of NFP.
These failing divs go to show the importance of only taking them at the specific target levels.
Below we see the EMA made the LL and price reached the next level to drag it there.
Then we get the signals... Price was in a bullish div at this target and the fast RSI was showing current weakness.
The bulls crossed the EMA this time and found support and subsequently went to the ABCD target.
Lots to consider there but nothing I haven't already explained.
Attached Image (click to enlarge)
Looking at the NFP news it was good for the bears but the charts say the opposite. To me news is just rubbish, better to pay attention to the reality of the charts.
Hi mentor, i am stuked in these two trades pleas help what to do now , i dont use stop and then fulishly hedge the losing trade now this is the scenario, profit is less and loss is huge. can i close both simaltaneously or close buy trade and left sell one for some loss recovery or any other solution for this you suggest