also careful not retested for 2nd fillof institutional orders always to big to fill on one helping , just be aware of that it happens 90 percent of the time
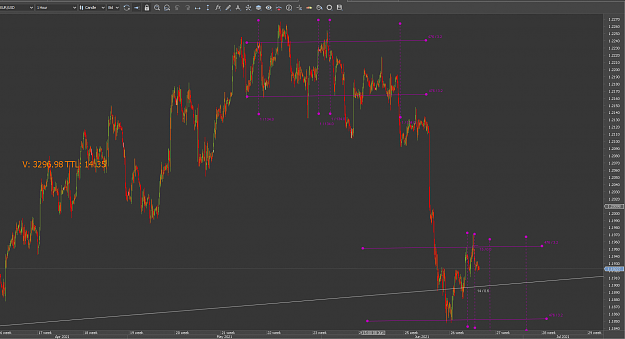
{quote} exactly to kl , true supply and demand {image}
Ignored
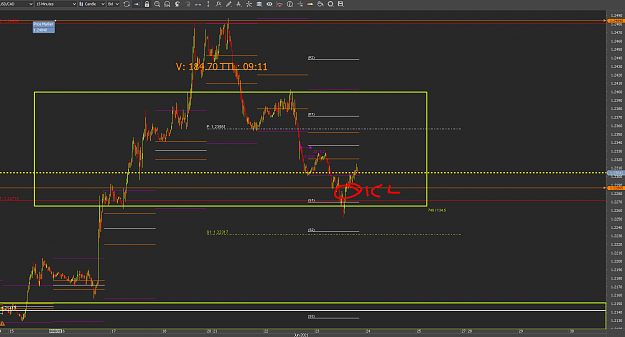
yup that's how there's a kl on cad at 1.22865
so again as pre-mentioned the 1.22865 kl is demand, slight dip below as s 1 daily there...................now your learning real supply real demand ...kl yow
{quote} yup that's how there's a kl on cad at 1.22865 so again as pre-mentioned the 1.22865 kl is demand, slight dip below as s 1 daily there...................now your learning real supply real demand ...kl yow {image}
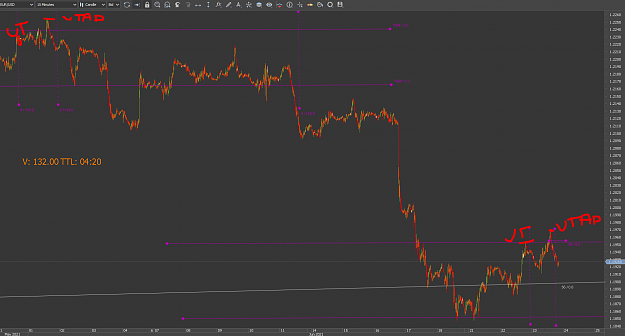
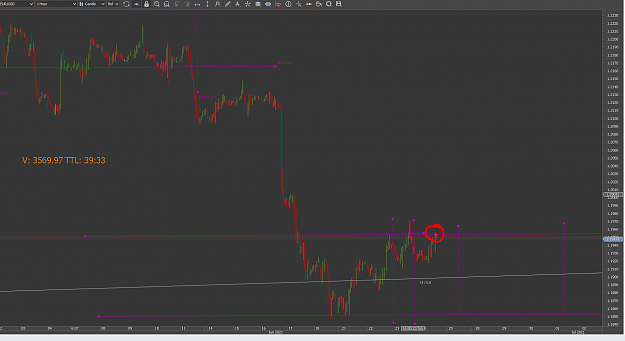
The first high is false hi so that you loose ur stops later that's called UT upthrust
after UT wait for the move down normally 20 to 30 pips then there will be an upthrust higher high then UT normally between 10 to 25 pips that's the UTAD the point u short as the same on EU and reverse for cad DT today.
UTAD take out UT high so that it take the stops before market shorts...Wyckoff warned the public how not to get killed by the pros
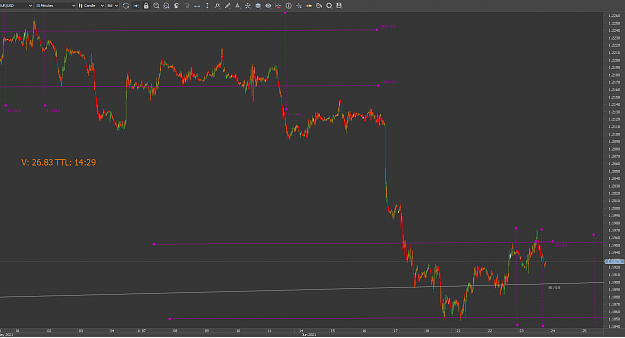
i know a lot of you have waisted your time in markets with gartleys , elliot wave and oscillators and mac d and so on.
Nothing I can do about that to become profitable it will be really hard to detox from all that , however, if your a new trader you will definitely make it to profitability
i know a lot of you have waisted your time in markets with galleys and oscillators and mac d and so on. Nothing I can do about that to become profitable it will be really hard to detox from all that , however, if your a new trader you will definitely make it to profitability {image}
Ignored
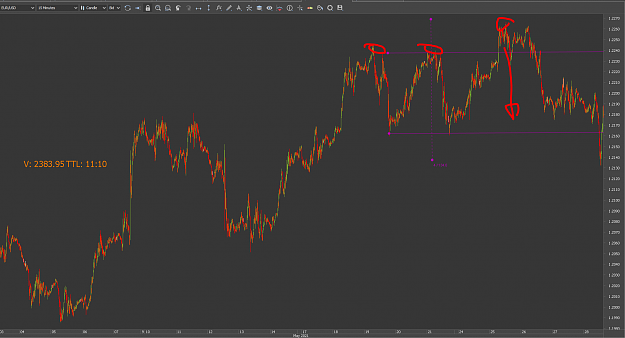
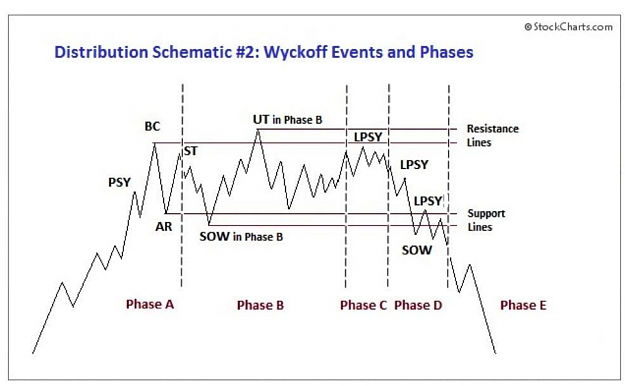
Classic Wyckoff
Phase C:
That is the most interesting phase of distribution. Main events are upthrust (UT) – move of price above TR and sharp reversal down and closing in TR. That is the time when all beginners go long. Yup, the worst time to go long – one of the most popular traps all get into. In a few words, phase C – is the phase of misleading retail traders – bulls, and bears as well. Aggressive traders open shorts after UT, as they have a very good risk/reward ratio. But big players are not ready to allow retailers to make money so easily. That is the reason why very often you can see a few UT one after the other. It’s a stop hunting in action. Conservative traders wait to open shorts until phase D and an LPSY
Wyckoff Distribution Schematic – Phases and Events Phase A: This phase marks the stopping of the uptrend. Till that time demand has been dominant and the first significant evidence of supply entering the market is provided by preliminary supply (PSY) and the buying climax (BC). Usually next what we see is a sharp, but limited move down – so-called automatic reaction (AR) and then a small leg up, known as a secondary test (ST) of the BC. Volume in this phase is usually diminished. That classic scenario by Wyckoff Method. But as can say from my experience the uptrend may also terminate without climactic action, instead of demonstrating exhaustion of demand with decreasing spread and volume, and with less upward progress made on each rally before significant supply emerges
{quote} they will keep pumping the tops to shake us out of shorts and pumping the lows to shake us put of longs, this industry hates retail to earn anything
Ignored
perfectic are they not , they hate retails so there cry babies trying to shake us all of