• Home
  • Forums
  • Trades
  • News
  • Calendar
  • Market
  • Brokers
  • Login
  • Join
  • User/Email: Password:
  • 6:33am
Menu
  • Forums
  • Trades
  • News
  • Calendar
  • Market
  • Brokers
  • Login
  • Join
  • 6:33am
Sister Sites
  • Metals Mine
  • Energy EXCH
  • Crypto Craft

Options

Bookmark Thread

First Page First Unread Last Page Last Post

Print Thread

Similar Threads

Reverse Engineering a Profitable System (REPS) 339 replies

Fractal Reverse Engineering Journal 21 replies

create a dom for trading 1 reply

DOM trading interfaces 4 replies

METATRADER REVERSE ENGINEERING 3 replies

  • Trading Discussion
  • /
  • Reply to Thread
  • Subscribe
  • 17
Attachments: Reverse engineering order flow from naked chart
Exit Attachments

Reverse engineering order flow from naked chart

  • Post #1
  • Quote
  • First Post: Jun 15, 2021 8:39pm Jun 15, 2021 8:39pm
  •  zkchyo
  • | Joined Jan 2021 | Status: Member | 34 Posts
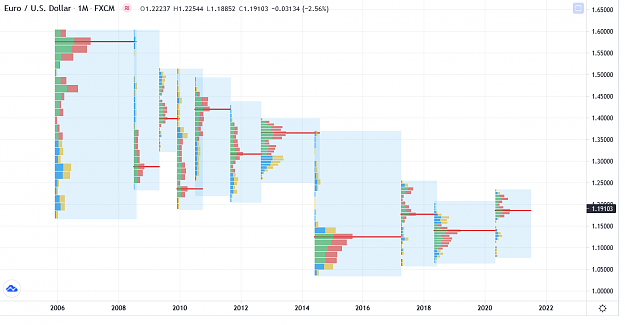
Forex market is decentralized and there is no correct volume for fx traders. I trade futures with volume profile and have been through DoM screening time. I start wondering whether there is way to reverse engineering order flow activities from a naked chart. Balance and imbalance are easy to spot; however, how to find a reasonable value area is harder. If I could get a value area, vpoc is an easy one. It's a s/r inside the value area. Does anyone have some ideas or trade this way?
Discretionary Quantitative Trader
  • Post #2
  • Quote
  • Jun 15, 2021 10:02pm Jun 15, 2021 10:02pm
  •  alps99
  • | Joined Jun 2018 | Status: Member | 67 Posts
POC often be at around 50% of the range, depends on the range's profile it could be heavier at lower or upper area.

What do you see in this area? I pulled the Fib from highest body to the lowest body.
Attached Image (click to enlarge)
Click to Enlarge

Name: IMG_20210616_085932.jpg
Size: 96 KB
 
1
  • Post #3
  • Quote
  • Edited at 10:27pm Jun 15, 2021 10:11pm | Edited at 10:27pm
  •  alps99
  • | Joined Jun 2018 | Status: Member | 67 Posts
Quoting alps99
Disliked
POC often be at around 50% of the range, depends on the range's profile it could be heavier at lower or upper area. What do you see in this area? I pulled the Fib from highest body to the lowest body. {image}
Ignored
This is the lower part
Attached Image (click to enlarge)
Click to Enlarge

Name: IMG_20210616_090831.jpg
Size: 35 KB


And the upper part
Attached Image (click to enlarge)
Click to Enlarge

Name: IMG_20210616_090906.jpg
Size: 32 KB


Notice the area which contains many small range bars consolidated inside the range was heavily distributed at lower part
Attached Image (click to enlarge)
Click to Enlarge

Name: IMG_20210616_090324.jpg
Size: 119 KB

The profile, thus, should be asymmetrical. The POC should be at the lower part.
Value area, to define it, easiest way is to ignore the lowest body as well as highest body part.
Attached Image (click to enlarge)
Click to Enlarge

Name: IMG_20210616_092332.jpg
Size: 113 KB

The POC should be at the most traded level, more often we see most candle tend to close nearby.
Also small observation, the last accumulate occurs above POC if price break to the upside afterwards, or below POC if price break to the downside.
Attached Images (click to enlarge)
Click to Enlarge

Name: IMG_20210616_091422.jpg
Size: 114 KB
Click to Enlarge

Name: IMG_20210616_091605.jpg
Size: 107 KB
 
3
  • Post #4
  • Quote
  • Jun 15, 2021 11:50pm Jun 15, 2021 11:50pm
  •  zkchyo
  • | Joined Jan 2021 | Status: Member | 34 Posts
Thanks for sharing your points. I completely agree with you about defining VA and POC. VA contains 70% volume of the profile. Without volume information, we have no choice but use an area covering most of candles instead. I think that's the reason you choose to ignore the highest and lowest body, right? IMO, there are some characteristics about VA and POC that could be used to refine them.

1. Since VA has the best liquidity, I expect to see candles leg in and leg out less frequently. Due to liquidity, there should be many small candles inside VA. I consider small candles present balance because the price range accepted by buyers and sellers should be narrow. From liquidity point of view, balance area should be narrow due to many limit orders around VA.

2. Within VA, price should seek liquidity from POC, so we could expect to see many wicks touch POC.

3. For VAH and VAL, they couldn't be easily broken and we could expect to see many rejections when price tends to get inside or outside of VA.

4. Once price gets within VA, I expect to see it touches POC.

This is the VA and POC that's in my head.

Attached Image
Discretionary Quantitative Trader
 
 
  • Post #5
  • Quote
  • Jun 16, 2021 3:59am Jun 16, 2021 3:59am
  •  pah
  • | Joined Apr 2011 | Status: Basket Case | 235 Posts
Quoting alps99
Disliked
{quote} This is the lower part {image} And the upper part {image} Notice the area which contains many small range bars consolidated inside the range was heavily distributed at lower part {image} The profile, thus, should be asymmetrical. The POC should be at the lower part. Value area, to define it, easiest way is to ignore the lowest body as well as highest body part. {image} The POC should be at the most traded level, more often we see most candle tend to close nearby. Also small observation, the last accumulate occurs above POC if price break...
Ignored
This is quite interesting stuff, thanks for sharing. Out of interest, do you trade this off the weekly charts or use that TF just for analysis purposes?
Regards, Paul.
 
 
  • Post #6
  • Quote
  • Edited at 1:36am Jun 17, 2021 12:27am | Edited at 1:36am
  •  alps99
  • | Joined Jun 2018 | Status: Member | 67 Posts
Quoting pah
Disliked
{quote} This is quite interesting stuff, thanks for sharing. Out of interest, do you trade this off the weekly charts or use that TF just for analysis purposes? Regards, Paul.
Ignored
Hi Paul. I vaguely understood about these before, but didn't really use it. Recently i come out with a theory about how it works, and still observing it. Although i don't know whether it's true in reality or not, or coincide with any concept that exist before, i'd discuss about it later, here.

It's all about market searching for liquidity. And what i mean liquidity here? We all know the ultimate reason for the existance of any market is "facilitate trade"; and at the Dealer level point of view, they dont make money by speculation, they make money by matching buyer and seller. The more trading activities the better.
Spread * the amount matched is profit.

If we see it as selling or buying pressure, support or resistance, Market only see it, the so called "Market structure" is:
- Where is the money? Where is no money?
What do i mean by "Money"?
Attached Image


At red: no buyer -> no trade, no money.
At blue: no seller. Too low. No money.
At purple: who ever wwants to buy, bought. Who ever wants to sell, sold. There is nothing left there.
At green: potential level. If price goes there, plenty of new buy/sell orders could be triggered, and that's "money" for dealer.
Price could left the "no money" level (purple) and search for green.
 
3
  • Post #7
  • Quote
  • Jun 17, 2021 9:24am Jun 17, 2021 9:24am
  •  pah
  • | Joined Apr 2011 | Status: Basket Case | 235 Posts
Thanks, I'd say your ideas are worth further investigation. It will be something I'll be looking at myself as time permits. Good luck!
Cheers, Paul.
 
 
  • Post #8
  • Quote
  • Jun 18, 2021 4:59am Jun 18, 2021 4:59am
  •  alps99
  • | Joined Jun 2018 | Status: Member | 67 Posts
What do you see? What is it doing?
EURUSD
Weekly chart
Attached Image (click to enlarge)
Click to Enlarge

Name: 8ef7fad8285c39bae3416a706dd45518.png
Size: 39 KB

And this is how it developed
Attached Image (click to enlarge)
Click to Enlarge

Name: d2b856e96a4663d60ceaed7c6eb2b7aa.png
Size: 150 KB
 
 
  • Post #9
  • Quote
  • Jun 18, 2021 5:09am Jun 18, 2021 5:09am
  •  zkchyo
  • | Joined Jan 2021 | Status: Member | 34 Posts
If I am on SierraChart, I'll just merge four profiles together because price doesn't go anywhere. You could see 2nd profile fill the imbalance of 1st profile and 4th fill 3rd. ICTers might call this as "fair value gap".
Discretionary Quantitative Trader
 
 
  • Post #10
  • Quote
  • Edited at 6:58am Jun 18, 2021 6:48am | Edited at 6:58am
  •  alps99
  • | Joined Jun 2018 | Status: Member | 67 Posts
Quoting zkchyo
Disliked
If I am on SierraChart, I'll just merge four profiles together because price doesn't go anywhere. You could see 2nd profile fill the imbalance of 1st profile and 4th fill 3rd. ICTers might call this as "fair value gap".
Ignored
It's not just "Gap". What they call "Gap" is just "non traded level" or "Non overlap" like this
Attached Image (click to enlarge)
Click to Enlarge

Name: f0223698c0efeb2a7474729e2d7419ed.png
Size: 12 KB

This is somewhat similar, but more. What the market does is it identifies thin market area, whether that area been traded thru or not, and fulfill it until achieving a near perfect form of "Normal distribution" before shifting to the whole new level with a massive movement
Attached Image (click to enlarge)
Click to Enlarge

Name: caba947d3ad3090d905c2624d4140d0a.png
Size: 36 KB

Attached Image (click to enlarge)
Click to Enlarge

Name: d1e205002c89cc3f78931c9c627746da.png
Size: 34 KB


I believe if we move to lower tf, same thing would happen. Even though it keeps filling the thin market of previous Profile, market has to do a breakout at some point. But i couldn't know how to make the connection between analyzing high tf to lower tf

Attached Image (click to enlarge)
Click to Enlarge

Name: 66b0d0ceb2437b331cc2e64047cb869e.png
Size: 46 KB

Attached Image (click to enlarge)
Click to Enlarge

Name: 7ef662c6b2fdeb1e38e5e2e3c9c609bb.png
Size: 44 KB
 
1
  • Post #11
  • Quote
  • Jun 18, 2021 7:00am Jun 18, 2021 7:00am
  •  alps99
  • | Joined Jun 2018 | Status: Member | 67 Posts
And i personally think EU would break several years consolidation range from 2015 to the upside and fill the void above, in confluence with multiple underlying fundamental conditions
 
 
  • Post #12
  • Quote
  • Jun 18, 2021 7:31am Jun 18, 2021 7:31am
  •  zkchyo
  • | Joined Jan 2021 | Status: Member | 34 Posts
I know that normal distribution talk but it doesn't convince me much. I think the reason is unfilled orders. Price would go there to grab more liquidities before continuing its direction. Low volume area candles could be merged together as a FVG candle due to fractal, so I am willing to consider they're the same thing. Price will always try to fill those low liquidity areas. A setup I know is using H4 to find this kind of move as direction and use lower time frame to trade it. It generates good RR. Trading within FVG is the same as the setup since there is still a FVG within a FVG on lower time frame (yep, fractal again). It's more like a scalping trade IMHO.
Discretionary Quantitative Trader
 
 
  • Post #13
  • Quote
  • Jun 18, 2021 7:37am Jun 18, 2021 7:37am
  •  zkchyo
  • | Joined Jan 2021 | Status: Member | 34 Posts
Quoting alps99
Disliked
And i personally think EU would break several years consolidation range from 2015 to the upside and fill the void above, in confluence with multiple underlying fundamental conditions
Ignored
I think there must be a big good news for Eurozone to breakout from VA. I don't pay too much attention on fundamentals but I read some news about US reducing Q.E. Won't it be an appreciation for dollar?
Discretionary Quantitative Trader
 
 
  • Post #14
  • Quote
  • Jun 18, 2021 8:49am Jun 18, 2021 8:49am
  •  alps99
  • | Joined Jun 2018 | Status: Member | 67 Posts
Quoting zkchyo
Disliked
{quote} I think there must be a big good news for Eurozone to breakout from VA. I don't pay too much attention on fundamentals but I read some news about US reducing Q.E. Won't it be an appreciation for dollar?
Ignored
Long-term perspective buddy, the dollar overvalued for years due to its reserve currency status. No the long-term trend reverse and combination with massive twin deficit. European, despite their aggressive monetary policy, their member countries have very hawkish approaches on fiscal policy.
You see in 2018-19, despite yield spread had widen that much, EU couldn't go lower than 2016's low. Another reason is the US equity market is also overvalue now vs many EU equity market, Price/earning is quite reasonable.
 
1
  • Post #15
  • Quote
  • Jun 18, 2021 9:00am Jun 18, 2021 9:00am
  •  prozor7
  • Joined Mar 2010 | Status: Member | 5,629 Posts
Quoting alps99
Disliked
{quote} I believe if we move to lower tf, same thing would happen. Even though it keeps filling the thin market of previous Profile, market has to do a breakout at some point. But i couldn't know how to make the connection between analyzing high tf to lower tf {image} {image}
Ignored
you are on the right track

I make a connection by overlapping "fibo" lines for each TF
Attached Image
Forex can only be understood backwards, but it must be traded forwards.
 
1
  • Post #16
  • Quote
  • Jun 20, 2021 5:39am Jun 20, 2021 5:39am
  •  alps99
  • | Joined Jun 2018 | Status: Member | 67 Posts
Quoting prozor7
Disliked
{quote} you are on the right track I make a connection by overlapping "fibo" lines for each TF {image}
Ignored
Could you be more clear? I don't understand the chart, maybe bigger chart and present from high to low tf?
 
 
  • Post #17
  • Quote
  • Jun 20, 2021 5:11pm Jun 20, 2021 5:11pm
  •  prozor7
  • Joined Mar 2010 | Status: Member | 5,629 Posts
Quoting alps99
Disliked
{quote} Could you be more clear? I don't understand the chart, maybe bigger chart and present from high to low tf?
Ignored
here
Forex can only be understood backwards, but it must be traded forwards.
 
1
  • Post #18
  • Quote
  • Edited at 9:33pm Jun 21, 2021 9:20pm | Edited at 9:33pm
  •  zkchyo
  • | Joined Jan 2021 | Status: Member | 34 Posts
Quoting prozor7
Disliked
{quote} here
Ignored
Your fibo way of trading is interesting. I used to be a pattern trader and I find TP by measuring and projecting fibs before I turned to institutional tools.
Many fibo traders fail to explain why golden ratio works. Could you explain it further? My theory is based on volatility but I kinda gave it up because it wasn't convincing enough.
Discretionary Quantitative Trader
 
 
  • Post #19
  • Quote
  • Last Post: Jun 22, 2021 3:07am Jun 22, 2021 3:07am
  •  prozor7
  • Joined Mar 2010 | Status: Member | 5,629 Posts
Quoting zkchyo
Disliked
{quote} Your fibo way of trading is interesting. I used to be a pattern trader and I find TP by measuring and projecting fibs before I turned to institutional tools. Many fibo traders fail to explain why golden ratio works. Could you explain it further? My theory is based on volatility but I kinda gave it up because it wasn't convincing enough.
Ignored
IMO fibo golden radio is a pattern on a planet, it is there in everything, why is there for me to explain, I'm not that well educated.

my theory is based on time and money (time is money) PA spend in/on each TF

alps99 beautifully explained in post3
Forex can only be understood backwards, but it must be traded forwards.
 
 
  • Trading Discussion
  • /
  • Reverse engineering order flow from naked chart
  • Reply to Thread
0 traders viewing now
Top of Page
  • Facebook
  • Twitter
About FF
  • Mission
  • Products
  • User Guide
  • Media Kit
  • Blog
  • Contact
FF Products
  • Forums
  • Trades
  • Calendar
  • News
  • Market
  • Brokers
  • Trade Explorer
FF Website
  • Homepage
  • Search
  • Members
  • Report a Bug
Follow FF
  • Facebook
  • Twitter

FF Sister Sites:

  • Metals Mine
  • Energy EXCH
  • Crypto Craft

Forex Factory® is a brand of Fair Economy, Inc.

Terms of Service / ©2022