Disliked{quote}
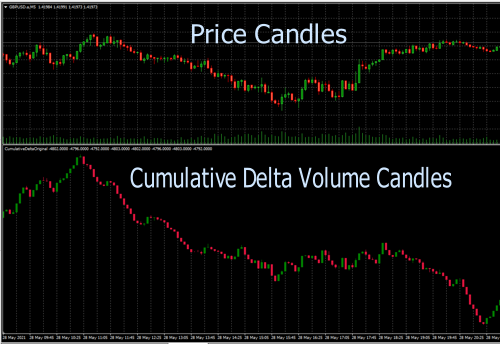
Hi TimeTells Here is my Chart and the action and the key signals were the Volume resistance lines telling us to Sell. These are formed by Absorption where Buyers are unable to move price upwards due to Selling pressure. The volume at the bottom was 8 times normal levels over the average GBPUSD M1 candles so that is also very important. Another point and one strategy I spend my day doing is Selling on Bid imbalance (yellow numbers) or Buying in Ask imbalance (white numbers) The basic no lose strategy should always be - TRADE AGAINST COLLAPSING...Ignored
Hi Rick,
Fabulous chart detail thank you.
I will of course look into it deeper later.
Yes that final flash down last 2 x one min candles was wild. I had closed out right before then lol at a pre-target I had visualised going in.
Very interesting stuff. Cheers.
2