{quote} Hi jnevins, I'm wondering how do you create these weekly outlook in Timing solution?
Ignored
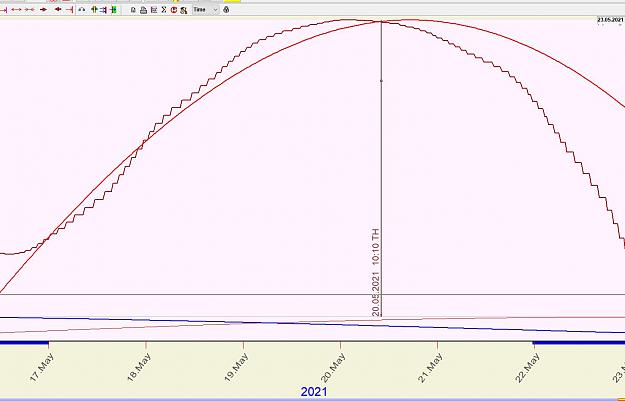
Hi Java,
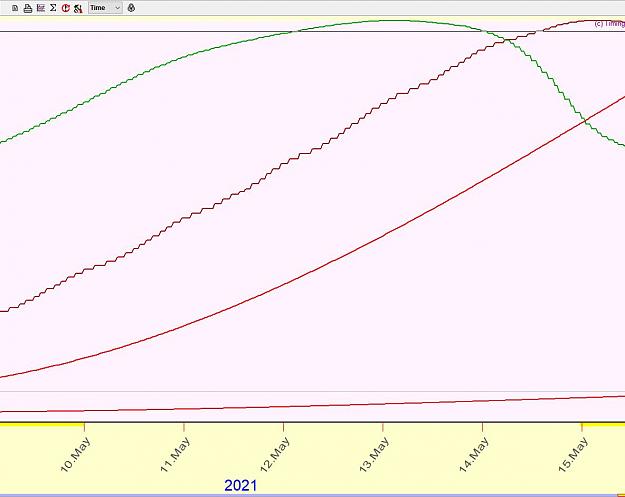
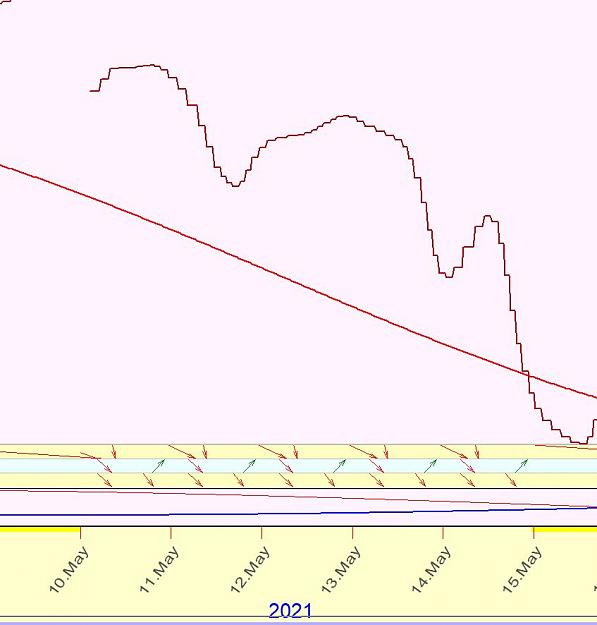
The brown projection line I mostly use is from the Astronomy module. The image is for next week's price action.... I inverted the Moon-Sun line to arrive at this outlook. I have 34 videos on how I use Timing Solution as one of the playlists on my YouTube channel...
{quote} EUR/USD completed short term high lil bit later than predicted Now we should be completing short term low after the weekend in 03-05.05.2021. Then we should see upward resume momentum So overall direction is SHORT then LONG: {image} DXY should be also completing weekly HIGH anytime after the weekend: {image} and GBPUSD for confirmation: {image}
Ignored
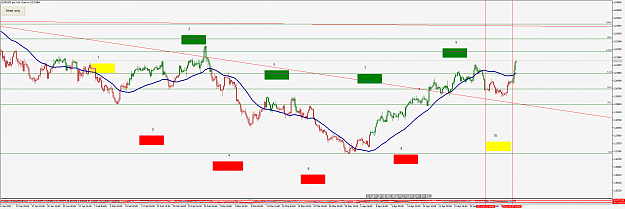
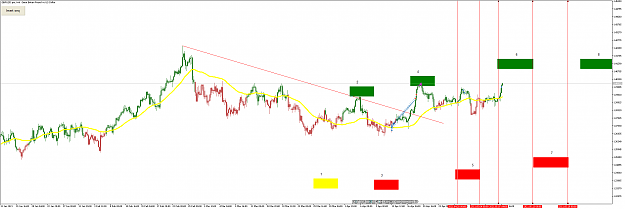
Going along nicely. EUR/USD found the bottom in the middle of short term low window. Now we should see only upward bias toward may/june breakthrough, with bigger/smaller retracements.
We should see the top in monday-tuesday period this week. then down (retracement) toward 12-18.05.2021 and strong bullish resume toward the end of the month.
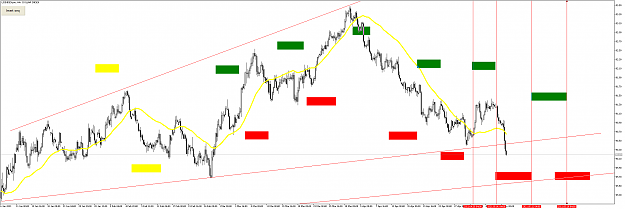
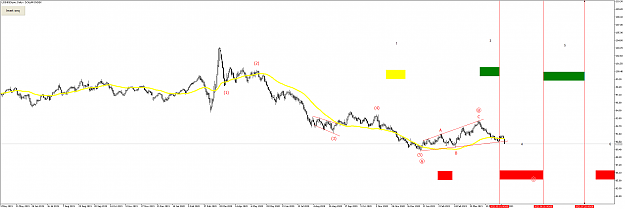
{quote} Going along nicely. EUR/USD found the bottom in the middle of short term low window. Now we should see only upward bias toward may/june breakthrough, with bigger/smaller retracements. We should see the top in monday-tuesday period this week. then down (retracement) toward 12-18.05.2021 and strong bullish resume toward the end of the month. EUR/USD: {image} USDOLLAR: {image} GBP/USD: {image}
Ignored
I am expecting 1830 in may/june, I wouldn't long at these levels...GBPUSD is at 4000, USDCHF at 9000...all very important zones and very likely a turning point for the dollar. I am expecting a dollar bull for weeks, maybe months to come, first target 93-95.
Everyone can see the chart, but only a few can actually read it.
{quote} I am expecting 1830 in may/june, I wouldn't long at these levels...GBPUSD is at 4000, USDCHF at 9000...all very important zones and very likely a turning point for the dollar. I am expecting a dollar bull for weeks, maybe months to come, first target 93-95.
Ignored
Only time will tell us , USDOLLAR just entered low window from medium and longterm interval, also in low window from the biggest cycle:
Hi just a quick observation on the sp500 low which came in on the 5th March 2021 at 3723 which is equivalent to 3 degrees Leo . but on examining this daily bar closer and assigning a 30 point range to it the top of the bar would equal 3753 or 5 deg Virgo . As the price moves around the circle it could encounter support on three different points but with the benefit of hindsight we can see that it actually made low at 3 deg Leo . So my question is how can we ascertain at which point of longitude the price will stop and verse at . There are three prices within the daily bars range that intersect different longitudinal points but how are we able to confirm which one will turn trend up . 3752 or 2 deg Virgo is opposite Helio Venus which is the ruling planet for that day but it did not halt price . the next point within the circle is 12 deg Leo or 3732 which is opposite Helio Jupiter which also did not halt price . the next point down is 3725 or 5 deg Leo which is opposite Helio Saturn which also did not stop the decline .price at 3723 is 2 deg below the longitude of Saturn but reasonably close. trading this time cycle into the 5th March would present three potential support points as price moves around the shell but would we determine which one in advance would turn trend up and halt the advance
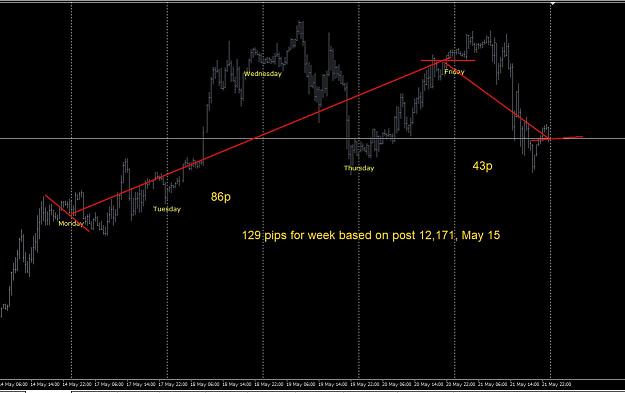
Outlook for next week: long until Thursday... consider a short position on a trendline break on Thursday. {image}
Ignored
Hi jnevins, last time you use only 1 line from the Moon and Sun inverted. But this one is different. May I know what setting do you use this time? Thanks
{quote} Hi jnevins, last time you use only 1 line from the Moon and Sun inverted. But this one is different. May I know what setting do you use this time? Thanks
Ignored
Hi Java,
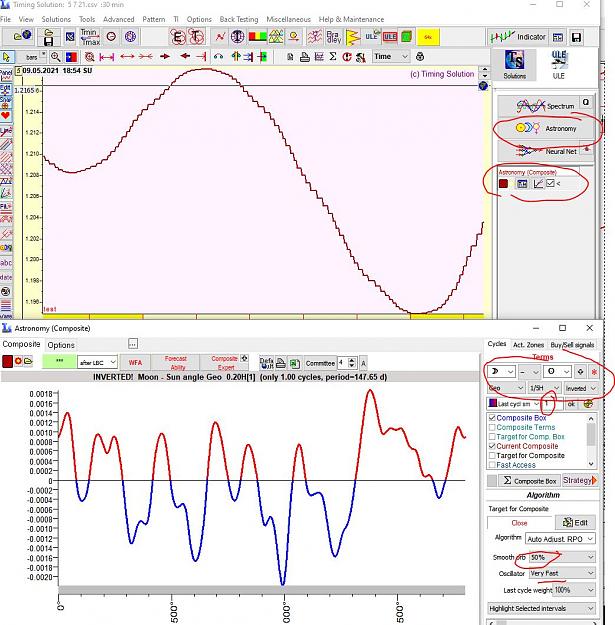
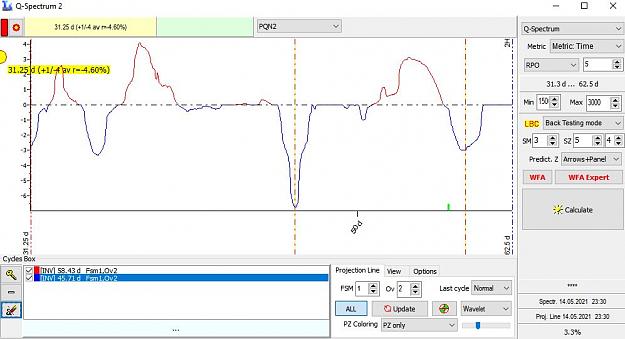
The brown line is the Moon-Sun 1/5, 50% sm orb, Inverted and the red line is Q Spectrum 2 with the settings in the image. I only choose the blue, inverted troughs closest to the 50 day line. I like checking the Q line against the Moon Sun line, especially when I have to invert the M-S line.
{quote} I am expecting 1830 in may/june, I wouldn't long at these levels...GBPUSD is at 4000, USDCHF at 9000...all very important zones and very likely a turning point for the dollar. I am expecting a dollar bull for weeks, maybe months to come, first target 93-95.
Ignored
I am expecting quite the opposite.
A gold and euro run for months to come.
Not sure what may trigger this but it could be some bad news related to USD.
So I get a lot of questions on how this all works.
I see just by all the trolls we got over the years that there is a lot of misunderstanding about using astro as a guide for our trading decisions.
Gann used the wisdom of the bible and through his studies he discovered some wisdom that was shared regarding cyclical motions of the planets and how these motions influenced the mood of the people on earth.
People buy stock, not planets, but the 'universe' especially our sun, does influence peoples mood. Many studies have been done on this subject and its a scientific fact that sunlight has an influence on our endorphins which enhance our mood and happiness.
Jenssen a man who used to work for Gann wrote about that in his book which I posted here some time ago.
So, like cause like effect. If certain planetary positions can cause a panic then all we need to look for it's cause, look through our chart data for a similar pattern and investigate if this effect had the same cause. Stock patterns repeat.
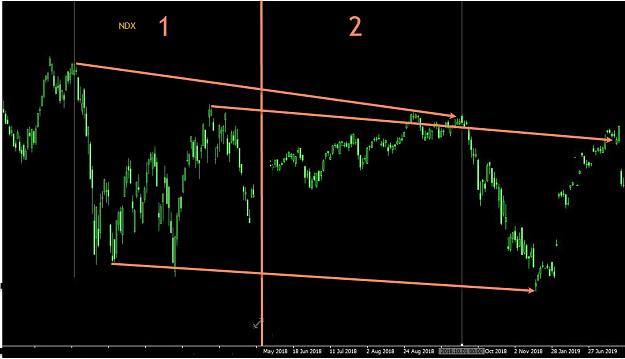
As an example I have here a picture of the Nasdaq but this example also works on other trading instruments. The picture on the left side (1) is an historic event compared with a more current event in picture (2) on the right.
You can see that price moves in about the same pattern, only at a different value. In these kind of moves it is mostly time that repeats, not price. Price is influenced by other factors such as inflation etc.
So, how to discover these patterns and make an estimate of a future occurrence.
You look for sharp drops in price and compare that with a 'synodic' cycle. This is a cycle between 2 planets e.g., Mars and Venus or Saturn and Venus etc, it could be any planetary combination according to the 7 pointed star as described by Gann in Tunnel Thru the Air, or looking back from 1940, in short "tunnel". https://i.pinimg.com/564x/10/e6/e0/1...254b350b47.jpg this is how planets relate to each other.
Then you look for a same price drop and compare the planetary positions.
Very important is that we are not necessarily looking for aspects, it could be a degree of the zodiac, a sign, or an ingress or long/lat declination etc. but most important a specific relation between the planets.
If you have a synodic cycle, and I suggest to start with Venus-Mars heliocentric, you write down all of the degrees 0-360 and relation between the two.
After one cycle comes the 2nd and you add the degrees starting with 361 - 720, then again 721 - 1080 etc etc. and compare these to the price patterns.
That is how this works, it is proven although not acknowledged.
Price patterns repeat, if you know the right beginning you know the right ending.
So I get a lot of questions on how this all works. I see just by all the trolls we got over the years that there is a lot of misunderstanding about using astro as a guide for our trading decisions. Gann used the wisdom of the bible and through his studies he discovered some wisdom that was shared regarding cyclical motions of the planets and how these motions influenced the mood of the people on earth. People buy stock, not planets, but the 'universe' especially our sun, does influence peoples mood. Many studies have been done on this subject and...
Ignored
sounds great Ilovepippin, what do you suggest which the 2 planets synodic cycle we can use for EURUSD pair friend?
{quote} For EURUSD the major synodic cycle is sun-moon.
Ignored
What people often don't realize is that the position of the sun is the count we use for our days on the calendar.
So, let say you have a synodic cycle that corresponds with a big move on a certain day and does so repeatedly, then in reality you have 3 "planets" in the same position as the sun will be on the same day/position as well.
Just saying...