DislikedHi Alan. Hope you are well. Would you mind explaining how a routiney trading day start for you? Like approx how long before bar 108 do you begin looking at charts, what you look for and which chart you go over. Best regards.Ignored
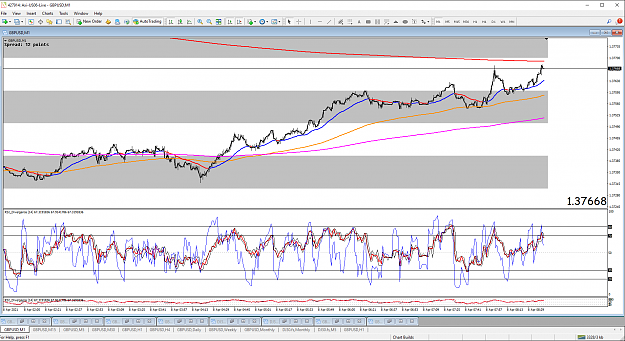
I look at all the chart up to the monthly but the higher the time frame the less I need to look at it. But each day I look to remind myself of the possibilities of shall we call them bias moves. In other words if the monthly is both trending and currently moving upwards that is then a bias to consider long options. BUT a lot of things can happen during a month so I would refer to this as being a weak bias and this would equally apply to the weekly chart from a day to day perspective.
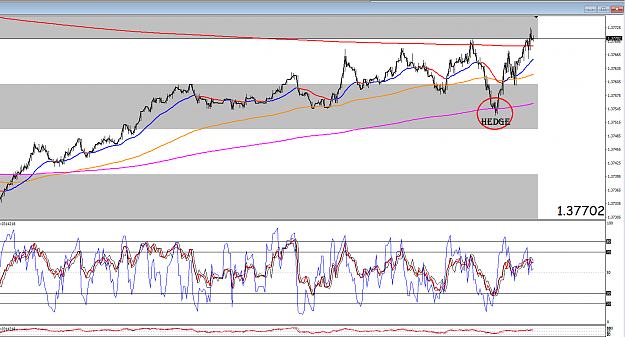
Now being aware of the above I drop to the one hour chart which is clearly showing me a few days of detail in respect to what is currently going on and that is what I am interested in for my trading purpose. So looking at the 1 hour chart I left intact from yesterday I begin to make some observations.....
Attached Image (click to enlarge)
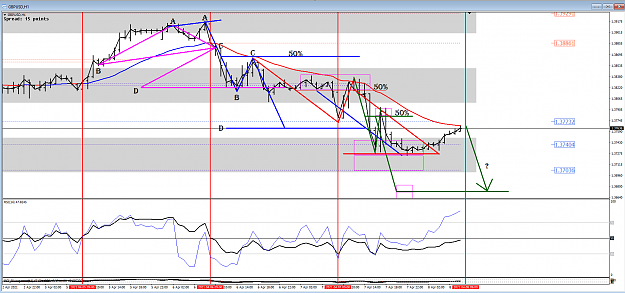
Now I see price has almost moved to where I expected it to go i.e. the EMA and now I would be taking notice of the lower time frames for selling signals.
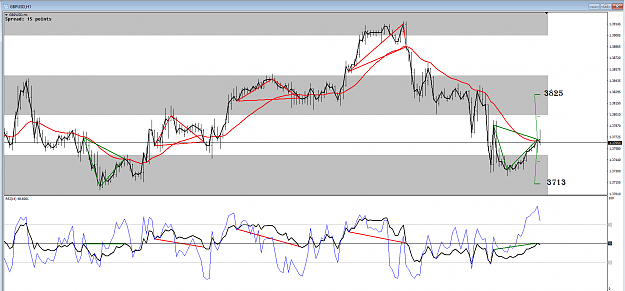
However I cannot assume price will actually turn south here But if it crosses the 1minute EMA I would be taking the chance with a tentative entry.
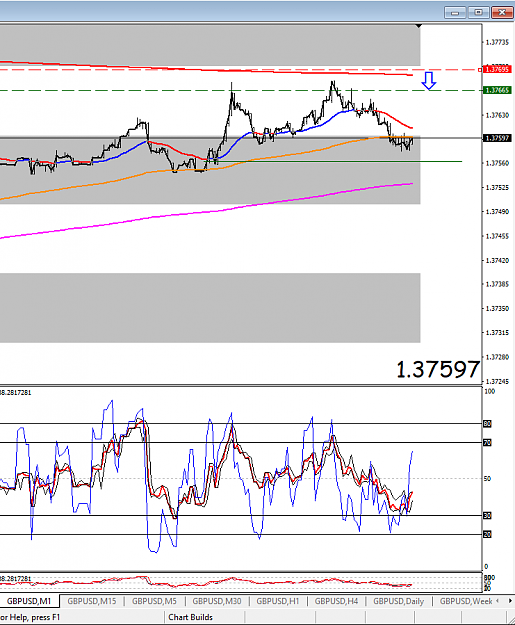
As we observe the 1 minute chart we see the EMA's are trying to align to the long side so patience here is required, Price is currently approaching the 1 hour EMA.
Attached Image (click to enlarge)
It is currently in divergence so a tentative short trade would be applied hoping for price to break the EMA if it doesn't then a HH will probably result so we get the stop to BE just in case.
Notice on the 1 minute the EMA has not made a LL all day only HH's so we have to be careful considering a short.