Hello!
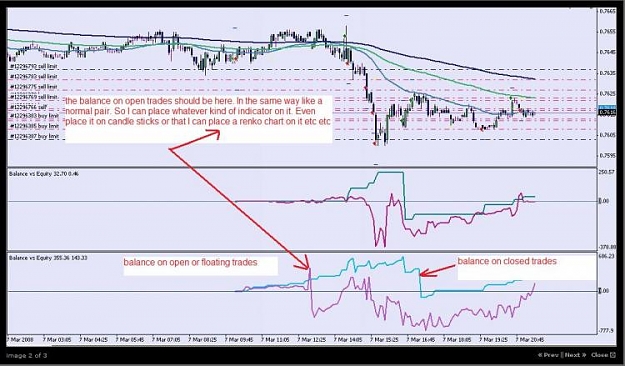
Does anyone know how to code an indicator that displays the balance and equity in the indicator chart window and draws lines to display this data historically. Im a bit over the metatrader way of doing it as you have to get a report and dosent show how your equity developes just your balance.
It must basically just work on any time frame and just draw a line as the chart progresses so will the balance and equity.
Attached is a picture I saw somewhere on the net but the person didnt share their indicator
Dont worry about his comments he left Im just keen on the two indicators he is running at the bottom.
Thanx so much.
Kind Regards.
Attached Image (click to enlarge)