hi everyone,
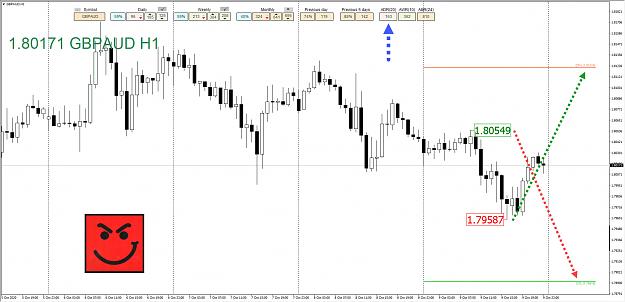
i have a question regarding ADR indicators that show a high and a low for the day based on ADR average of a given period.
my question is what is the reference point for ir to draw the high/low? it dosnt seem to be open of the day because high and low are not same distance from open.
cheers
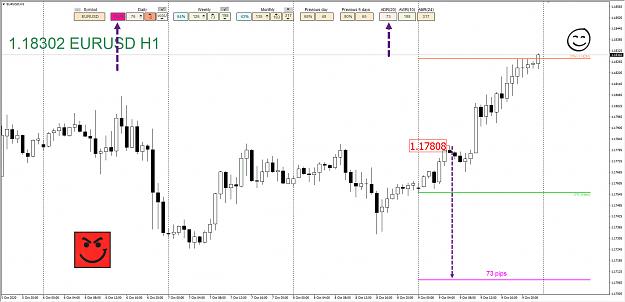
i have a question regarding ADR indicators that show a high and a low for the day based on ADR average of a given period.
my question is what is the reference point for ir to draw the high/low? it dosnt seem to be open of the day because high and low are not same distance from open.
cheers