• Home
  • Forums
  • Trades
  • News
  • Calendar
  • Market
  • Brokers
  • Login
  • Join
  • User/Email: Password:
  • 7:22pm
Menu
  • Forums
  • Trades
  • News
  • Calendar
  • Market
  • Brokers
  • Login
  • Join
  • 7:22pm
Sister Sites
  • Metals Mine
  • Energy EXCH
  • Crypto Craft

Options

Bookmark Thread

First Page First Unread Last Page Last Post

Printable Version

Similar Threads

EUR/USD Extensive Elliot Wave Analysis 1 reply

GBPCHF Buying Wave (V) Elliot Wave 0 replies

Elliot wave Analysis in stocks 106 replies

Elliot wave analysis - Multiple pairs 8 replies

Rao Journal: Elliot Wave Analysis 38 replies

  • Interactive Trading
  • /
  • Reply to Thread
  • Subscribe
  • 794
Attachments: Elliot Wave Analysis
Exit Attachments

Elliot Wave Analysis

  • Last Post
  •  
  • 1 51525354Page 55 56
  • 1 5354Page 55 56
  •  
  • Post #1,081
  • Quote
  • Feb 19, 2021 4:00am Feb 19, 2021 4:00am
  •  stringfx
  • Joined Nov 2006 | Status: Sting | 828 Posts
Quoting pips4life
Disliked
What MT4 broker demo feed has the DXY chart? I found something on XMGlobal that might be similar to yours... Andrews Pitchforks, and derived forks, may offer some clues for the USDX-MAR21,Daily chart I've attached. The most recent leg came up and hit one of the derived lines I've shown, so I'm inclined to be more bearish in the near term. However, price did hit the black Andrews MedianLine, and bounce up. It so happens the Red Andrews fork has nearly the same UML as the black ML, so there is confluence, which in my mind, makes it much stronger....
Ignored
If you are talking about my charts .. yes i am using XM Global. I have a live account with them and also the demo account which is my TE.

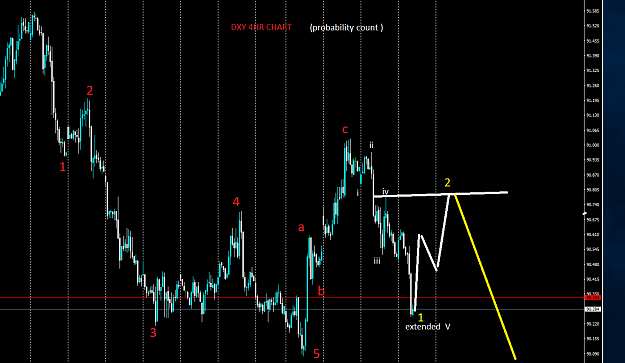
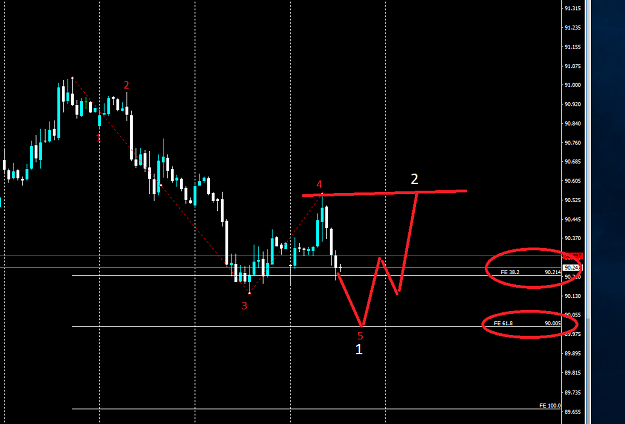
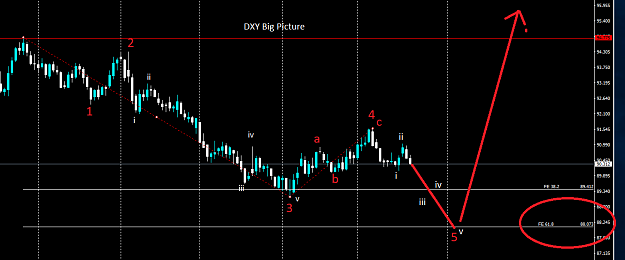
I have put my big picture (daily count) earlier... here it is again. My expectation for this move down is around 88.10 (5th wave).
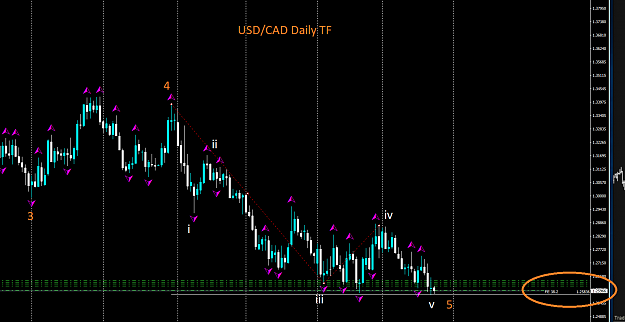
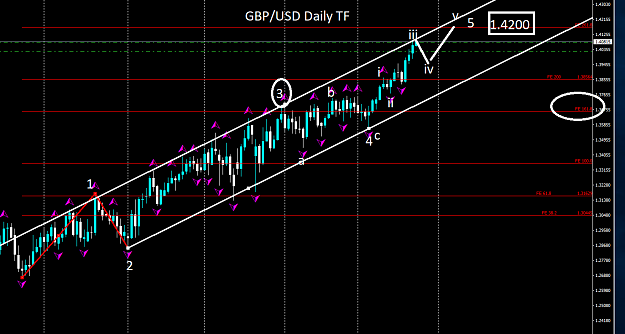
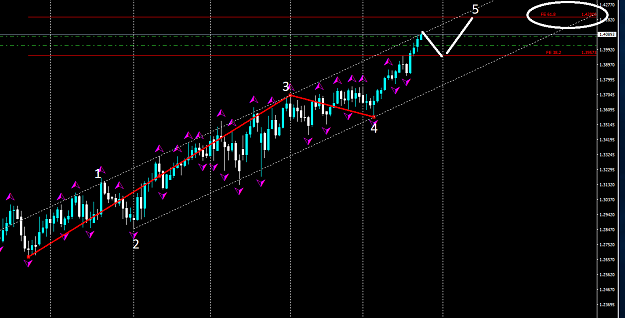
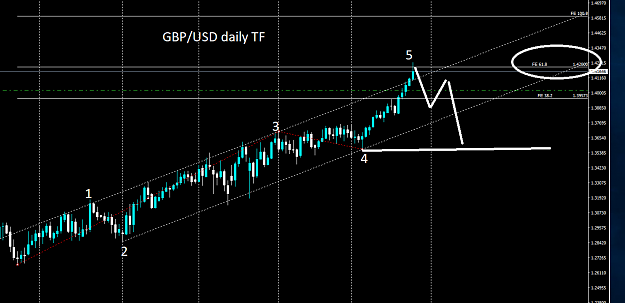
Your ultimate target With AP is very similar to my EW count.. so that's interesting ! The earlier charts are shorter form . I trade live with daily charts only. Good luck !
Attached Image (click to enlarge)
Click to Enlarge

Name: dxy24.png
Size: 35 KB
STING
1
  • Post #1,082
  • Quote
  • Feb 19, 2021 4:12am Feb 19, 2021 4:12am
  •  stringfx
  • Joined Nov 2006 | Status: Sting | 828 Posts
Quoting Molaro
Disliked
Yes exacly.... and looking to buy €/$ under 1.2000 {image}
Ignored

Looking at dxy ... this looks like an impulsive 5 wave down move. it doesn't resemble a B wave So most probably this could be the start of wave 3 as in wave 1 complete ... now a move up for wave 2..

We have to wait and see to pull the trigger. If it breaks the low then we can be sure to a large extent.
Attached Image (click to enlarge)
Click to Enlarge

Name: dxy25.png
Size: 66 KB
STING
1
  • Post #1,083
  • Quote
  • Feb 19, 2021 4:28am Feb 19, 2021 4:28am
  •  stringfx
  • Joined Nov 2006 | Status: Sting | 828 Posts
EUR/USD the opposite of DXY .. .needs a correction to the downside ... probably 50% decline and then shoot up ... mostly will not happen today .. possibility of a weekend gap with some fundamentals. Clear showing of divergence on the chart ... but anything can happen .. the reins are in the hands of big banks and hedge funds ...
Attached Image (click to enlarge)
Click to Enlarge

Name: EU3.png
Size: 56 KB
STING
2
  • Post #1,084
  • Quote
  • Feb 22, 2021 3:23am Feb 22, 2021 3:23am
  •  stringfx
  • Joined Nov 2006 | Status: Sting | 828 Posts
EUR/USD 4 HR.

My take on Eur/usd is that ... On daily TF, a 4th wave is completed and i believe that 1st and 2nd wave of the 5th major wave is also done. We have started on the 3rd and quite possibly the largest wave of the 5 wave series. Here i am showing a 4 hr chart of the 1st wave of 3rd minor wave and possibly we are in the 2nd wave with one more leg to go down. Hopefully it will finish by 50% of the 1st wave but it can go lower. Generally on eur/usd, 50% is the norm. after this correction, we should be getting a nice rally to 161.8% of the 1st wave . A chart will follow after the correction. Good luck!
Attached Image (click to enlarge)
Click to Enlarge

Name: EU1.png
Size: 70 KB
STING
  • Post #1,085
  • Quote
  • Feb 22, 2021 7:13am Feb 22, 2021 7:13am
  •  stringfx
  • Joined Nov 2006 | Status: Sting | 828 Posts
Quoting stringfx
Disliked
{quote} Looking at dxy ... this looks like an impulsive 5 wave down move. it doesn't resemble a B wave So most probably this could be the start of wave 3 as in wave 1 complete ... now a move up for wave 2.. We have to wait and see to pull the trigger. If it breaks the low then we can be sure to a large extent. {image}
Ignored
Looking at the DXY chart at the moment, it seems the wave 2 has not started yet, looking at lower time frames the third minor wave is still not over. WAve 3 has 5 waves in them , i cannot see them complete in lower time frames .. so here is my 2 cent on the current scenario ...

Wave 3 was extended to 400% .

Just my 2 cent .....
Attached Images (click to enlarge)
Click to Enlarge

Name: dxy 1 hr.png
Size: 31 KB Click to Enlarge

Name: dxy1hr1.png
Size: 35 KB
STING
  • Post #1,086
  • Quote
  • Feb 22, 2021 7:21am Feb 22, 2021 7:21am
  •  stringfx
  • Joined Nov 2006 | Status: Sting | 828 Posts
Attached Image (click to enlarge)
Click to Enlarge

Name: dxy10.png
Size: 26 KB
STING
  • Post #1,087
  • Quote
  • Feb 22, 2021 7:25am Feb 22, 2021 7:25am
  •  stringfx
  • Joined Nov 2006 | Status: Sting | 828 Posts
Attached Image (click to enlarge)
Click to Enlarge

Name: dxy11.png
Size: 25 KB
STING
  • Post #1,088
  • Quote
  • Feb 22, 2021 9:57am Feb 22, 2021 9:57am
  •  hans91
  • | Joined Jul 2018 | Status: Member | 446 Posts
Quoting stringfx
Disliked
{image}
Ignored
So, Your prediction is bullish or bearish for DXY?
  • Post #1,089
  • Quote
  • Feb 22, 2021 11:15am Feb 22, 2021 11:15am
  •  stringfx
  • Joined Nov 2006 | Status: Sting | 828 Posts
Quoting hans91
Disliked
{quote} So, Your prediction is bullish or bearish for DXY?
Ignored
Medium term bearish to 88.10

Short term bullish till 90.55 to 90.65. Once 90.65 is reached ... core bearish on dxy.

My charts are self explanatory.

Minor wave 1 is over. waiting for wave 2 to reach 90.65 then down on wave 3 till 88.90.
STING
  • Post #1,090
  • Quote
  • Feb 22, 2021 2:11pm Feb 22, 2021 2:11pm
  •  tiborf71
  • Joined Apr 2011 | Status: Member | 1,983 Posts
eurusd.
my analysis says that now the south will be the right direction.
h1.
  • Post #1,091
  • Quote
  • Feb 22, 2021 2:21pm Feb 22, 2021 2:21pm
  •  stringfx
  • Joined Nov 2006 | Status: Sting | 828 Posts
Quoting tiborf71
Disliked
eurusd. my analysis says that now the south will be the right direction. h1.
Ignored
yes you are right... on H1 eur/usd is heavily overbought and temporary south direction is preferred but it might not last for long..
STING
  • Post #1,092
  • Quote
  • Feb 22, 2021 3:04pm Feb 22, 2021 3:04pm
  •  tiborf71
  • Joined Apr 2011 | Status: Member | 1,983 Posts
Quoting stringfx
Disliked
{quote} yes you are right... on H1 eur/usd is heavily overbought and temporary south direction is preferred but it might not last for long..
Ignored
yes, you may be right because if the bulls are very strong then the south direction will only be temporary.
  • Post #1,093
  • Quote
  • Feb 22, 10:39pm (44 hr ago) Feb 22, 10:39pm (44 hr ago)
  •  stringfx
  • Joined Nov 2006 | Status: Sting | 828 Posts
Here is what i think on USD/CAD Daily Timeframe...

There may be a good possibility that a major wave has completed it's 5 wave downward move on this pair and a good possibility that this pair can go up on a very large correction to the upside. My calculations are solely based on Fibonacci ratios and this last wave has done the usual and minimum target down to 38.2 and on the daily TF, we can see a slight rejection. This is the reason i have taken some positions in demo account so far but not on my live account. we still have to wait and see if this thing will push down to 61.8 fib level as well. Here is a chart
Attached Image (click to enlarge)
Click to Enlarge

Name: usdcad.png
Size: 61 KB
STING
  • Post #1,094
  • Quote
  • Feb 22, 10:55pm (44 hr ago) Feb 22, 10:55pm (44 hr ago)
  •  stringfx
  • Joined Nov 2006 | Status: Sting | 828 Posts
The problem with elliott wave is that we really can't pin-point the targets if a wave has really completed it's journey but then again no other system can do that as well. So technically fib ratios is what i resort to.

I am writing this because i have an alternate count for DXY in which the major correction to the upside has already begun but i feel it's unlikely which is why i have not shown it here else it may be confusing. There is a good possibility that the 5th major wave has completed with the last low on daily time frame and we have started a major ABC correction to the upside but a larger possibility is that there is still room to make one more low to complete the major 5th wave and then the correction. I am not putting a chart for the possibility of confusion in younger minds... so if you are trading corrections, manage your account accordingly by trading tiny lot sizes. Retail traders are like guppies to be eaten by the hedge funds and big banks, so they always try to trade against the retail sentiment. Good luck !!
STING
1
  • Post #1,095
  • Quote
  • Feb 22, 11:10pm (44 hr ago) Feb 22, 11:10pm (44 hr ago)
  •  Boulder
  • Joined Jul 2014 | Status: Member | 19,062 Posts
Quoting stringfx
Disliked
The problem with elliott wave is that we really can't pin-point the targets if a wave has really completed it's journey but then again no other system can do that as well. So technically fib ratios is what i resort to. I am writing this because i have an alternate count for DXY in which the major correction to the upside has already begun but i feel it's unlikely which is why i have not shown it here else it may be confusing. There is a good possibility that the 5th major wave has completed with the last low on daily time frame and we have started...
Ignored
I have been interested in wave analysis for a few months now. I have to say its pretty challenging for me not knowing much. I like reading your posts. thanks for sharing your info.
  • Post #1,096
  • Quote
  • Feb 22, 11:31pm (43 hr ago) Feb 22, 11:31pm (43 hr ago)
  •  stringfx
  • Joined Nov 2006 | Status: Sting | 828 Posts
Quoting Boulder
Disliked
{quote} I have been interested in wave analysis for a few months now. I have to say its pretty challenging for me not knowing much. I like reading your posts. thanks for sharing your info.
Ignored
Thank you for your interest. It is an amazing tool in my opinion but very subjective as well. Thanks for the kind words and it's always a pleasure to share my 2 cents when possible.
STING
1
  • Post #1,097
  • Quote
  • Feb 23, 5:01am (38 hr ago) Feb 23, 5:01am (38 hr ago)
  •  tiborf71
  • Joined Apr 2011 | Status: Member | 1,983 Posts
the fifth wave has finished at the north peak, now the price must fall.
gbpusd.
h1.
  • Post #1,098
  • Quote
  • Feb 23, 5:37am (37 hr ago) Feb 23, 5:37am (37 hr ago)
  •  stringfx
  • Joined Nov 2006 | Status: Sting | 828 Posts
Quoting tiborf71
Disliked
the fifth wave has finished at the north peak, now the price must fall. gbpusd. h1.
Ignored
I agree ... but why don't you post a chart to support your statement ...
STING
  • Post #1,099
  • Quote
  • Feb 23, 5:53am (37 hr ago) Feb 23, 5:53am (37 hr ago)
  •  stringfx
  • Joined Nov 2006 | Status: Sting | 828 Posts
Here is my take on GBPUSD daily Time frame ... There is a bit more to go to finish the 5th wave as per Fibonacci and channel.

It would need a correction to the downside to complete 4th minor wave and then a final push up to complete 5th.

Here are 2 charts with Fibo expansion targets
Attached Images (click to enlarge)
Click to Enlarge

Name: GBPUSD.png
Size: 57 KB Click to Enlarge

Name: gbpusd1.png
Size: 47 KB
STING
1
  • Post #1,100
  • Quote
  • Feb 23, 10:37pm (20 hr ago) Feb 23, 10:37pm (20 hr ago)
  •  stringfx
  • Joined Nov 2006 | Status: Sting | 828 Posts
update on GBP/USD.

Gbp/Usd tore through without any retracement to target levels of 61.8 and have displayed a slight rejection. I wouldn't take any short position on this monster at the moment as it looks like being in a frenzied state. There is also GBP monetary policy meeting report hearing sometime later on. There was no particular news on gbp in Asian session . probably got excited with NZD rate statement. anyway this is my proposed chart at the moment but it's quite possible this final wave could be an extended wave so please tread with caution. Here is a chart....
Attached Image (click to enlarge)
Click to Enlarge

Name: GU1.png
Size: 36 KB
STING
2
  • Interactive Trading
  • /
  • Elliot Wave Analysis
  • Reply to Thread
    • 1 51525354Page 55 56
    • 1 5354Page 55 56
0 traders viewing now
  • More
Top of Page
  • Facebook
  • Twitter
About FF
  • Mission
  • Products
  • User Guide
  • Media Kit
  • Blog
  • Contact
FF Products
  • Forums
  • Trades
  • Calendar
  • News
  • Market
  • Brokers
  • Trade Explorer
FF Website
  • Homepage
  • Search
  • Members
  • Report a Bug
Follow FF
  • Facebook
  • Twitter

FF Sister Sites:

  • Metals Mine
  • Energy EXCH
  • Crypto Craft

Forex Factory® is a brand of Fair Economy, Inc.

Terms of Service / ©2021