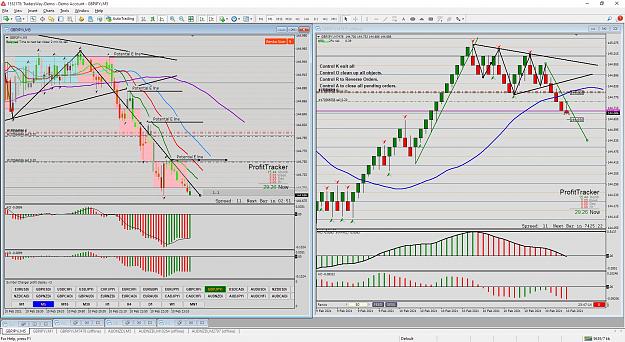
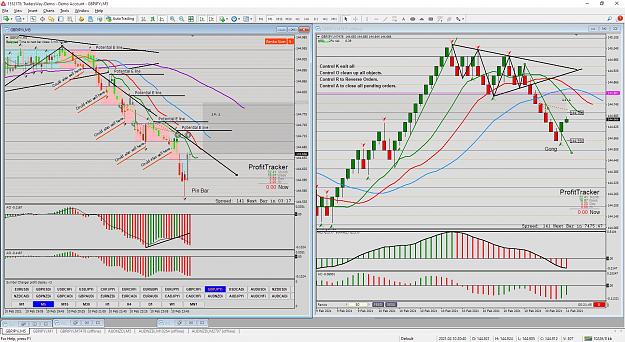
All the tools:
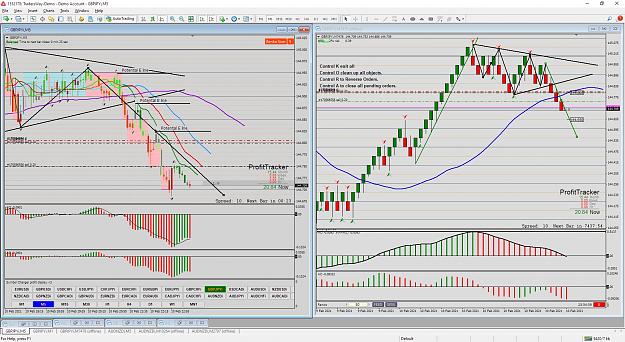
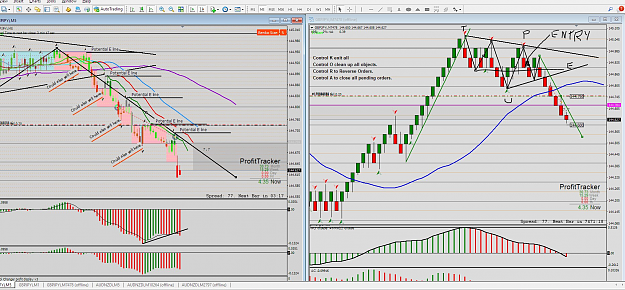
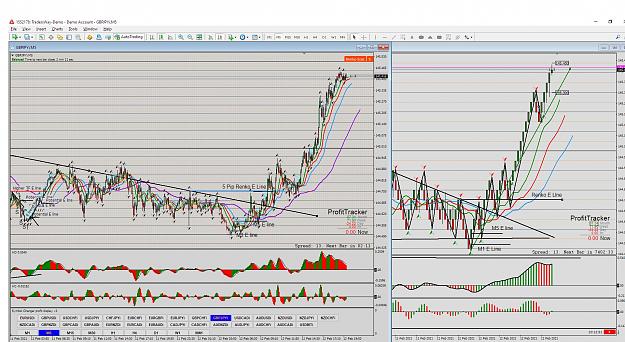
The BW Zone turns red on the M5 chart tells us (in case we forget to look at them) that AO and AC are both in synch.
I also turned on the Fractal on the M5 chart. You can see all of the potential Eline levels are based on the Fractals. We will move our potential E line down ot the next Fractal once we get past the last down fractal and confirm a higher low has arrived.
That is of course our Ebb or next potential E line level on M5.
And at that point, we will redraw our trend line from potential E to potential E.
Ah yes, the purple line on M5? It is where the Red Teeth line of the Alligator is located on a higher time frame.
It is a 31 displaced 24 smoothed MA of the Median price. (more on that later.)
You can zoom out on the chart and see where it is significant.
Attached Image (click to enlarge)
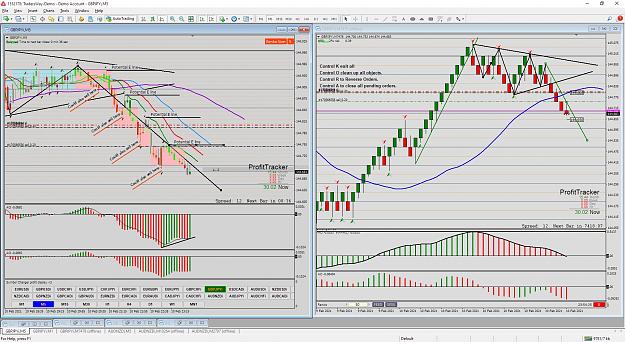
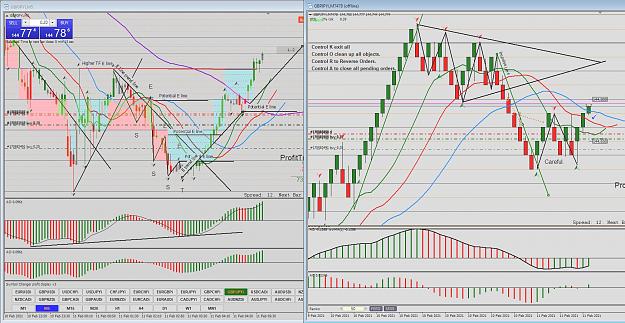
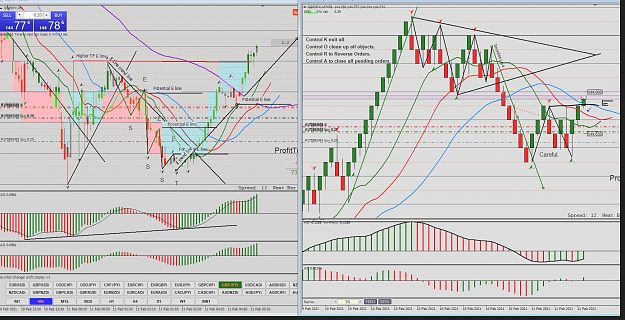
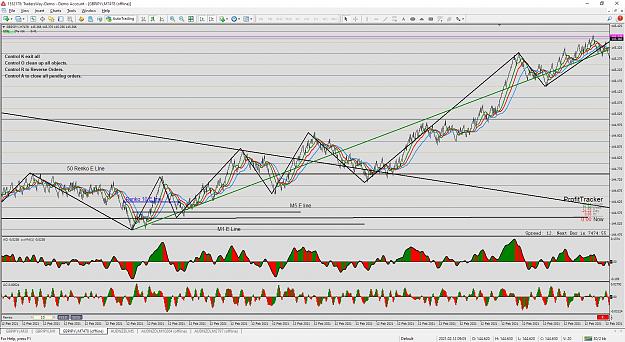
The BW Zone turns red on the M5 chart tells us (in case we forget to look at them) that AO and AC are both in synch.
I also turned on the Fractal on the M5 chart. You can see all of the potential Eline levels are based on the Fractals. We will move our potential E line down ot the next Fractal once we get past the last down fractal and confirm a higher low has arrived.
That is of course our Ebb or next potential E line level on M5.
And at that point, we will redraw our trend line from potential E to potential E.
Ah yes, the purple line on M5? It is where the Red Teeth line of the Alligator is located on a higher time frame.
It is a 31 displaced 24 smoothed MA of the Median price. (more on that later.)
You can zoom out on the chart and see where it is significant.