first post after short "hello" leave impression of "another silver food trader", my suggestion; if you like to avoid that is to present yours trading plan for GOLD than ask for opinion, I will gladly share mine
Forex can only be understood backwards, but it must be traded forwards.
My gold trading plan is to not trade gold. Gold is in a consolidation since jan 11 2021. Today im expecting it to go up for a bit and slide down again.
{quote} can you explain what this image represent, I don't understand thx
Ignored
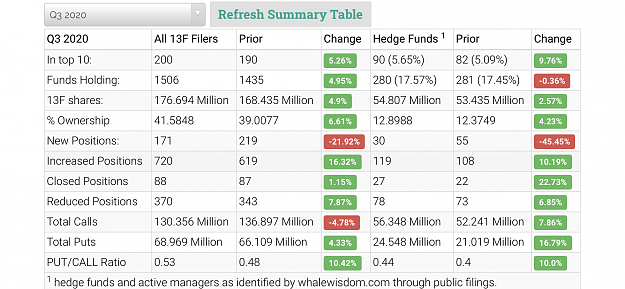
It represents the positions of hedge funds and big market players that traded the GLD etf in Q3 2020.
As you can see in the image they dumped their shares and this was reported nov 2020. *each gld share cost 170 usd. Gld etf seeks to reflect the price of gold. It allows people to invest in gold without owning the physical asset.
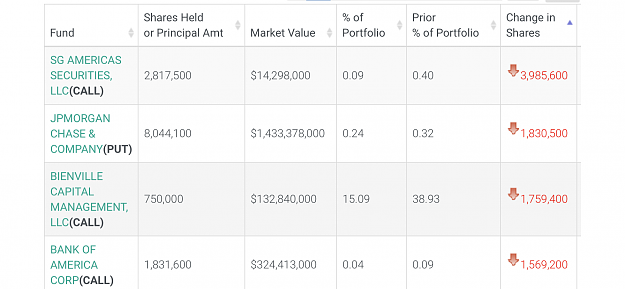
{quote} ok what is hedge funds positions @ what price? please explain columns, how to read those numbers.... we can learn something new and interesting here. thx
Ignored
I think its self explanatory. I will just post the link here of the gld etf so people can check if they want
*for the position, buying gld etf means you are bullish in gold. Same as to enter a call option. While put is bearish. We cannot see the exact price they entered but sometimes it will show the average price in the column.
{quote} It represents the positions of hedge funds and big market players that traded the GLD etf in Q3 2020. As you can see in the image they dumped their shares and this was reported nov 2020. *each gld share cost 170 usd. Gld etf seeks to reflect the price of gold. It allows people to invest in gold without owning the physical asset. this data can also be seen in sec.gov {image}
Ignored
thx
can we know current position of the hedge funds?
Forex can only be understood backwards, but it must be traded forwards.