• Home
  • Forums
  • Trades
  • News
  • Calendar
  • Market
  • Brokers
  • Login
  • Join
  • User/Email: Password:
  • 11:17pm
Menu
  • Forums
  • Trades
  • News
  • Calendar
  • Market
  • Brokers
  • Login
  • Join
  • 11:17pm
Sister Sites
  • Metals Mine
  • Energy EXCH
  • Crypto Craft

Options

Bookmark Thread

First Page First Unread Last Page Last Post

Printable Version

  • Interactive Trading
  • /
  • Reply to Thread
  • Subscribe
  • 10,906
Attachments: vsa with Malcolm
Exit Attachments

vsa with Malcolm

  • Last Post
  •  
  • 1 1680168116821683Page 1684 1685
  • 1 Page 1684 1685
  •  
  • Post #33,661
  • Quote
  • Edited at 8:26pm Jan 15, 2021 7:37pm | Edited at 8:26pm
  •  Cyberforex
  • | Joined May 2020 | Status: Member | 112 Posts
Quoting dr_who
Disliked
Now I haven't read the whole thread, however I know a fair amount about VSA as I used (then abandoned) the concept a few years ago. The big question for me is how the hell do you trade forex using VSA as, particularly for traders using MT4, your Volume is nonsense and doesn't necessarily reflect the entire market, in fact that in itself is probably impossible ? I am happy to be educated...
Ignored
well this is question that i also asked myself as i first know about VSA. Forex volume (MT4) is bit different it is the activity observed in each bar or candlestick. It doesnt need to be accurate 100%, even from broker to broker is the volume bit different. It doesnt matter, because what we need is to observe the big professional traders activity. Their footprint is presented and everywhere to be found and could be read in the forex volume. Thats all I need, I just trade following them, forex volume should be enough ... imho.

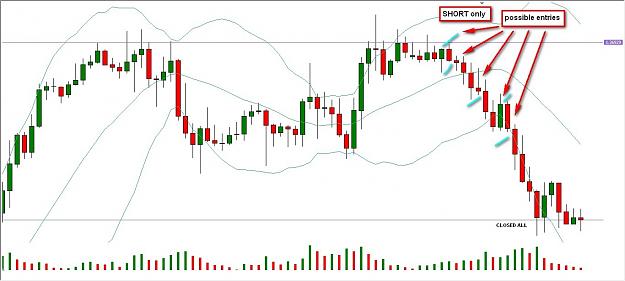
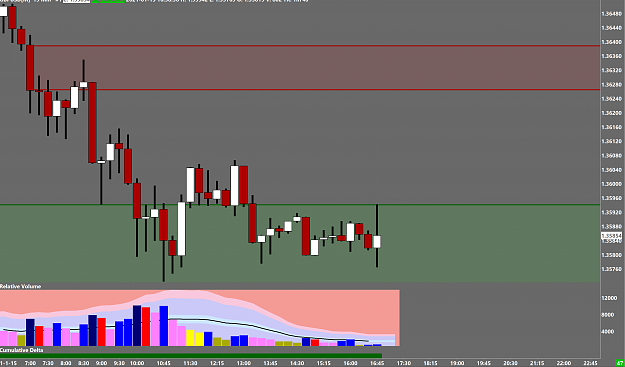
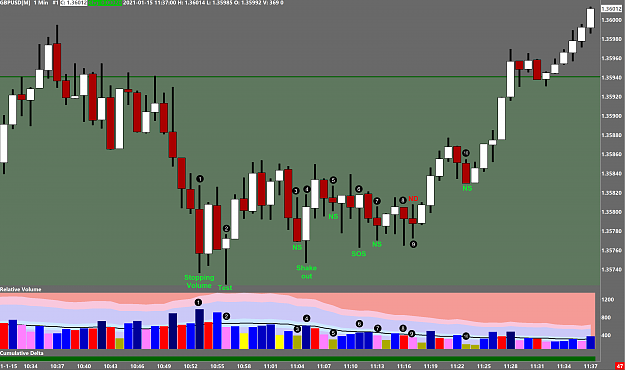
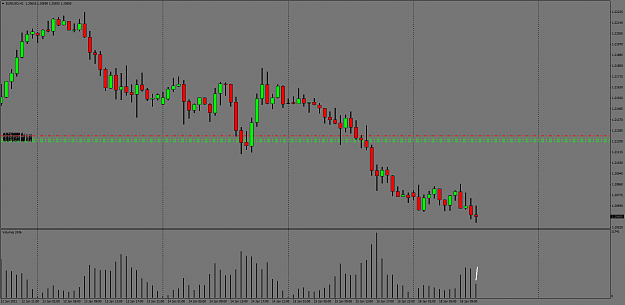
actually I can show you entry points based from VSA from any assets from forex pair, DAX, DOW, GOLD, Bitcoin ... anything from yesterday (friday, 15-01-2021) ... was easy trading day ... but i'm bit lazy to do that. ... lol.

Just read back in the forum ... you will find great great analysis from Malcolmb, HiddenGAP, Anotan and any other great trader in this forum.

Anyway ... there is thousand strategy out there, a simple moving average strategy will work too if you can use it correctly, it hasnt to be VSA .... so if you think that it will not work then find the other one ... ha ha ha ...

the less trader use VSA, the better it is ... we need the crowd ... just kidding lol ....
2
  • Post #33,662
  • Quote
  • Edited at 9:33pm Jan 15, 2021 9:18pm | Edited at 9:33pm
  •  RickM
  • Joined Sep 2015 | Status: Member | 1,126 Posts
Quoting dr_who
Disliked
Now I haven't read the whole thread, however I know a fair amount about VSA as I used (then abandoned) the concept a few years ago. The big question for me is how the hell do you trade forex using VSA as, particularly for traders using MT4, your Volume is nonsense and doesn't necessarily reflect the entire market, in fact that in itself is probably impossible ? I am happy to be educated...
Ignored
Hi Dr Who

The problem is we need to use Volume where we have access to real data in real time. I would argue it doesn't matter what exchange you follow, if big money gets dumped on the market in London, it will be followed in other exchanges.

I trade GBPUSD more than any other market - therefore I use data based on the US currency coming out of Chicago.
I trade candles on my brokers chart but use VOLUME data directly of CME - 6B volume.

If some exchange goes heavy, I will see it within seconds on 6B


On the lower chart, they were day lows
Notice the time to trade is those lower white candles after the huge red bearish candles. It’s telling us there is only buyers now.

Cheers
Attached Images (click to enlarge)
Click to Enlarge

Name: 6b.jpg
Size: 266 KB Click to Enlarge

Name: footprint A.jpg
Size: 113 KB
Trading thin liquidity at the boundary of the charts
7
  • Post #33,663
  • Quote
  • Jan 15, 2021 9:46pm Jan 15, 2021 9:46pm
  •  Anotan
  • Joined Jan 2015 | Status: Member | 621 Posts
Haven't really posted much, feel like there isn't much more I can say.

One thing is, its good to be aware of whats going on in the world.

By all accounts Friday should have been an up day, high volume down bar on the low of Thursday and a healthy up move following it. During Asia on Friday a 1.9 Trillion dollar stimulus was announced, which is very good for USD. The yellow line marks the bar when the announcement was made, which is a SoW.

Looking to exit this trade sometime Monday, my entry was terrible should have started to enter once the low of the potential selling bar was taken out.
Attached Image (click to enlarge)
Click to Enlarge

Name: EURUSDH1.png
Size: 68 KB
6
  • Post #33,664
  • Quote
  • Jan 15, 2021 11:22pm Jan 15, 2021 11:22pm
  •  Pip-Miner
  • Joined Nov 2015 | Status: I'm hungry | 3,971 Posts
Quoting RickM
Disliked
{quote} Hi Dr Who The problem is we need to use Volume where we have access to real data in real time. I would argue it doesn't matter what exchange you follow, if big money gets dumped on the market in London, it will be followed in other exchanges. I trade GBPUSD more than any other market - therefore I use data based on the US currency coming out of Chicago. I trade candles on my brokers chart but use VOLUME data directly of CME - 6B volume. If some exchange goes heavy, I will see it within seconds on 6B On the lower chart, they were day lows...
Ignored
Well done mate sounds like you solved the fake volume issue . PVSR method still no 1 method my books using discretionary trading.
  • Post #33,665
  • Quote
  • Edited at 8:06am Jan 16, 2021 6:08am | Edited at 8:06am
  •  Cyberforex
  • | Joined May 2020 | Status: Member | 112 Posts
Quoting RickM
Disliked
{quote} Hi Dr Who The problem is we need to use Volume where we have access to real data in real time. I would argue it doesn't matter what exchange you follow, if big money gets dumped on the market in London, it will be followed in other exchanges. I trade GBPUSD more than any other market - therefore I use data based on the US currency coming out of Chicago. I trade candles on my brokers chart but use VOLUME data directly of CME - 6B volume. If some exchange goes heavy, I will see it within seconds on 6B On the lower chart, they were day lows...
Ignored
Great chart RickM ....
  • Post #33,666
  • Quote
  • Jan 16, 2021 7:50am Jan 16, 2021 7:50am
  •  RickM
  • Joined Sep 2015 | Status: Member | 1,126 Posts
Quoting Cyberforex
Disliked
{quote} Ok I have a bit time right now .... I dont understand why the time to trade is at that time, as i observed on your chart it is M1 chart it should be around at 17:00-18:00 (pepperstone time server) .. thats around the time when i closed my all positions because i dont want to hold my short over the weekend ... and it could be that the highest volume at that time because the day trader closed positions because of the weekend? i dont think that professional trader have interest to open position at that time and hold positions over the weekend...
Ignored
Hi Cyberforex

I didn't buy at the low, I brought at the first major bearish move at 15:11.
Here you can see low volume Buyers, no resistance from sellers causing price to rise. The whole game is an attempt to trap traders by moving against their positions.
Those bearish traders got trapped so would also now have to buy to cover themselves.

As I trade M1, each trade target is only 10-15 pips each trade. I do this (or attempt to) about 70-100 times a London session.

Why did I take a trade here so close to days close - because volume is readable and tradeable and I was still short of my daily profit target.


Cheers
Attached Image (click to enlarge)
Click to Enlarge

Name: Foot print chart GU.jpg
Size: 93 KB
Trading thin liquidity at the boundary of the charts
4
  • Post #33,667
  • Quote
  • Jan 16, 2021 8:21am Jan 16, 2021 8:21am
  •  Cyberforex
  • | Joined May 2020 | Status: Member | 112 Posts
Quoting RickM
Disliked
{quote} Hi Cyberforex I didn't buy at the low, I brought at the first major bearish move at 15:11. Here you can see low volume Buyers, no resistance from sellers causing price to rise. The whole game is an attempt to trap traders by moving against their positions. Those bearish traders got trapped so would also now have to buy to cover themselves. As I trade M1, each trade target is only 10-15 pips each trade. I do this (or attempt to) about 70-100 times a London session. Why did I take a trade here so close to days close - because volume is readable...
Ignored
I would say wow 70 - 100 times a day ... what a great concentration what a power ...

happy nice weekend
  • Post #33,668
  • Quote
  • Jan 16, 2021 9:05am Jan 16, 2021 9:05am
  •  Anotan
  • Joined Jan 2015 | Status: Member | 621 Posts
Quoting Cyberforex
Disliked
{quote} I would say wow 70 - 100 times a day ... what a great concentration what a power ... happy nice weekend
Ignored
Depending on the amount of trades and his spread thats something like 500-1500 pips a week for his broker.

Expensive operating costs, but on the other side growth seems like it would be raised exponentially.
  • Post #33,669
  • Quote
  • Jan 16, 2021 9:21am Jan 16, 2021 9:21am
  •  Cyberforex
  • | Joined May 2020 | Status: Member | 112 Posts
Quoting Anotan
Disliked
{quote} Depending on the amount of trades and his spread thats something like 500-1500 pips a week for his broker. Expensive operating costs, but on the other side growth seems like it would be raised exponentially.
Ignored
yeah, thats why i am wondering to people with such ability, with VSA actually we could get an optimized entry and exit point, so for me better adding position and let the existing position open and close it all at the right time .. more relaxed no stress ... could still go anywhere enjoy the life ....

but people have different tastes ... as long as it is profitable then why not ....
Attached Image (click to enlarge)
Click to Enlarge

Name: 3.jpg
Size: 120 KB
1
  • Post #33,670
  • Quote
  • Jan 16, 2021 12:19pm Jan 16, 2021 12:19pm
  •  ryuryu
  • Joined Apr 2020 | Status: Member | 285 Posts
Guys, can you suggest good VSA indicator for mt5? Also where did you buy your real time volume data? Thanks!
greed and fear
  • Post #33,671
  • Quote
  • Jan 17, 2021 10:48am Jan 17, 2021 10:48am
  •  Patje
  • Joined Dec 2017 | Status: Member | 812 Posts
Quoting RickM
Disliked
{quote} Hi Cyberforex I didn't buy at the low, I brought at the first major bearish move at 15:11. Here you can see low volume Buyers, no resistance from sellers causing price to rise. The whole game is an attempt to trap traders by moving against their positions. Those bearish traders got trapped so would also now have to buy to cover themselves. As I trade M1, each trade target is only 10-15 pips each trade. I do this (or attempt to) about 70-100 times a London session. Why did I take a trade here so close to days close - because volume is readable...
Ignored
That looks like a great example of trapped traders at levels of interest or expansion in your case... Aggressive selling while price went up again... Great trade!
  • Post #33,672
  • Quote
  • Jan 17, 2021 2:57pm Jan 17, 2021 2:57pm
  •  HiddenGap
  • Joined Aug 2009 | Status: Reading the tape | 2,231 Posts
Quoting RickM
Disliked
Notice the time to trade is those lower white candles after the huge red bearish candles. It’s telling us there is only buyers now.
Ignored
I've said it before and I'll say it again, I am a fan. Thank you for posting. I hope to see more posts in this thread from you. There's a lot of knowledge to be gained from reading (and studying) your posts. This is a Volume Spread Analysis (VSA) thread, but as far as I'm concerned, all types of volume analysis are welcome.

Take a look at the charts below.

Attached Image (click to enlarge)
Click to Enlarge

Name: Example 2.png
Size: 92 KB


This first chart is a 15-minute chart. This is the time frame from which the Supply/Demand Delta Zone is drawn. Unlike most VSAers, I am not into multiple time frame analysis. But your chart is a 1-minute chart and I just wanted to state where the zone on the chart comes from.

Attached Image (click to enlarge)
Click to Enlarge

Name: Example 3.png
Size: 144 KB


This second chart is a 1-minute chart.

From a VSA perspective, what's telling us there are "only buyers now" would be all the DOWN (close < previous close) intervals on volume less than the previous two intervals. What VSA would call No Supply or a Test.

I don't mean to criticize or state that you are wrong- I hope you post more, not less. I just want to make a distinction for the VSAers that are just starting out.

The Dark (open>close) intervals, which many people would call bearish, VSA sees as bullish (based on volume, or close within the range, or range itself, or some combination therein). Because strength, when it appears, usually appears on DOWN bars. The White (open<close) intervals are bullish as they are confirming the strength seen in the previous Dark (open>close ((DOWN)) interval by closing UP.
The TREND isn't just your friend; it's your lover.
4
  • Post #33,673
  • Quote
  • Jan 18, 2021 5:31am Jan 18, 2021 5:31am
  •  dr_who
  • | Joined Oct 2007 | Status: Member | 431 Posts
Quoting RickM
Disliked
{quote} Hi Dr Who The problem is we need to use Volume where we have access to real data in real time. I would argue it doesn't matter what exchange you follow, if big money gets dumped on the market in London, it will be followed in other exchanges. I trade GBPUSD more than any other market - therefore I use data based on the US currency coming out of Chicago. I trade candles on my brokers chart but use VOLUME data directly of CME - 6B volume. If some exchange goes heavy, I will see it within seconds on 6B On the lower chart, they were day lows...
Ignored
Thanks for that. Well, in your case there may be an exception but I doubt very much that many MT4 users go to that length and they are potentially being fooled by false volume. Keep up the good work....
  • Post #33,674
  • Quote
  • Jan 18, 2021 5:42am Jan 18, 2021 5:42am
  •  Anotan
  • Joined Jan 2015 | Status: Member | 621 Posts
Granted this current bar still has 20 minutes left, but seems like sellers are running out of gas and a good time to get out.

Nice 60 pips, I still have flash backs to the small ADRs of 2019 and hope we don't see times like that any time soon.
Attached Image (click to enlarge)
Click to Enlarge

Name: EURUSDH1.png
Size: 35 KB
3
  • Post #33,675
  • Quote
  • Jan 18, 2021 6:59am Jan 18, 2021 6:59am
  •  Cyberforex
  • | Joined May 2020 | Status: Member | 112 Posts
Quoting dr_who
Disliked
{quote} Thanks for that. Well, in your case there may be an exception but I doubt very much that many MT4 users go to that length and they are potentially being fooled by false volume. Keep up the good work....
Ignored
dont worry we do enjoy being fooled ... lol
1
  • Post #33,676
  • Quote
  • Jan 19, 2021 5:22am Jan 19, 2021 5:22am
  •  Cyberforex
  • | Joined May 2020 | Status: Member | 112 Posts
today is a bit tricky to enter position (GBPUSD) therefore i reduce my lot size because i want to reduce my risk, anyway here is my entry and target line. Possibly after the target cross from that area the price could go back down.

I may be wrong ... happy trading
Attached Image (click to enlarge)
Click to Enlarge

Name: 2021-01-19_171924.jpg
Size: 102 KB
2
  • Post #33,677
  • Quote
  • Edited at 9:25pm Jan 19, 2021 7:20am | Edited at 9:25pm
  •  Cyberforex
  • | Joined May 2020 | Status: Member | 112 Posts
For GOLD i dont have any position yet still waiting a good entry maybe at new york time but here is my trading plan for GOLD

i may be wrong ....
Attached Image (click to enlarge)
Click to Enlarge

Name: 2021-01-19_191932.jpg
Size: 112 KB
1
  • Post #33,678
  • Quote
  • Jan 19, 2021 7:35am Jan 19, 2021 7:35am
  •  Cyberforex
  • | Joined May 2020 | Status: Member | 112 Posts
and here is my position and target for BITCOIN, well we should be aware trading bitcoin because of the high volatility i trade it just for fun with small lot for learning process.

i may be wrong ....
Attached Image (click to enlarge)
Click to Enlarge

Name: 2021-01-19_193116.jpg
Size: 126 KB
1
  • Post #33,679
  • Quote
  • Jan 19, 2021 9:32am Jan 19, 2021 9:32am
  •  Cyberforex
  • | Joined May 2020 | Status: Member | 112 Posts
Quoting Cyberforex
Disliked
today is a bit tricky to enter position (GBPUSD) therefore i reduce my lot size because i want to reduce my risk, anyway here is my entry and target line. Possibly after the target cross from that area the price could go back down. I may be wrong ... happy trading {image}
Ignored
closed GU long position with small profit because not supported by volume ... think about to short ... lets see
1
  • Post #33,680
  • Quote
  • Jan 19, 2021 9:37am Jan 19, 2021 9:37am
  •  Anotan
  • Joined Jan 2015 | Status: Member | 621 Posts
Quoting Cyberforex
Disliked
{quote} closed GU long position with small profit because not supported by volume ... think about to short ... lets see
Ignored
good call.. looked nice for a rally but price fizzled out.
  • Interactive Trading
  • /
  • vsa with Malcolm
  • Reply to Thread
    • 1 1680168116821683Page 1684 1685
    • 1 Page 1684 1685
2 traders viewing now, 1 is a member:
Trade007
  • More
Top of Page
  • Facebook
  • Twitter
About FF
  • Mission
  • Products
  • User Guide
  • Media Kit
  • Blog
  • Contact
FF Products
  • Forums
  • Trades
  • Calendar
  • News
  • Market
  • Brokers
  • Trade Explorer
FF Website
  • Homepage
  • Search
  • Members
  • Report a Bug
Follow FF
  • Facebook
  • Twitter

FF Sister Sites:

  • Metals Mine
  • Energy EXCH
  • Crypto Craft

Forex Factory® is a brand of Fair Economy, Inc.

Terms of Service / ©2021