• Home
  • Forums
  • Trades
  • News
  • Calendar
  • Market
  • Brokers
  • Login
  • Join
  • User/Email: Password:
  • 11:32am
Menu
  • Forums
  • Trades
  • News
  • Calendar
  • Market
  • Brokers
  • Login
  • Join
  • 11:32am
Sister Sites
  • Metals Mine
  • Energy EXCH
  • Crypto Craft

Options

Bookmark Thread

First Page First Unread Last Page Last Post

Print Thread

Similar Threads

I will code your scalping EAs for no charge 40 replies

I will code your pivot EAs for no charge 19 replies

Need help to code EAs for MT4 and MT5 4 replies

EAs and indicators relating to moutaki... 22 replies

InterbankFX has loaded its MT4 platform with custom EAs, indicators and scripts 1 reply

  • Platform Tech
  • /
  • Reply to Thread
  • Subscribe
  • 40,137
Attachments: I will code your EAs and Indicators for no charge
Exit Attachments
Tags: I will code your EAs and Indicators for no charge
Cancel

I will code your EAs and Indicators for no charge

  • Last Post
  •  
  • 1 21592160Page 216121622163 2916
  • 1 Page 2161 2916
  •  
  • Post #43,201
  • Quote
  • Jan 13, 2021 9:37am Jan 13, 2021 9:37am
  •  sahniana
  • | Joined Sep 2010 | Status: Member | 14 Posts
Quoting Rhevl
Disliked
{quote} Thank you! It works perfectly to my needs now. I knew it had to be a simple solution.
Ignored
usually this kind of flow, confusing at loop code. i just repair the "for" part.
 
 
  • Post #43,202
  • Quote
  • Jan 13, 2021 12:13pm Jan 13, 2021 12:13pm
  •  classy
  • Joined Jun 2012 | Status: Trader , Analyst and Mentor | 4,580 Posts
Quoting cja
Disliked
{quote} {quote} Am I right in thinking you want to show the Highest High /Lowest Low over X number of Bars OK so what exactly are the Close and Open showing? I think you need to supply a lot more info on how you are going to use this indicator and what you expect it to be able to do.
Ignored
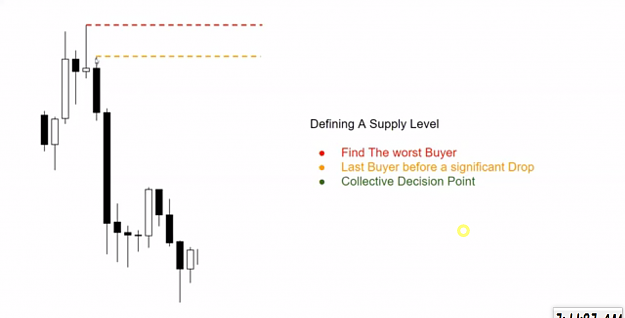
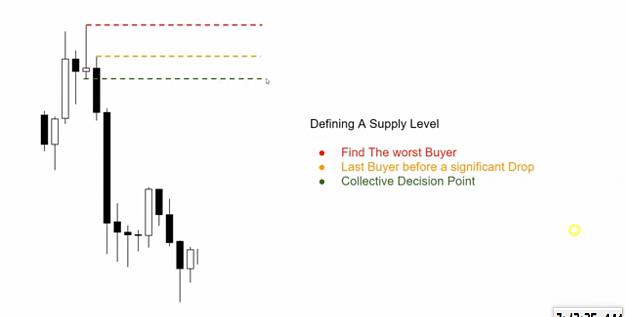
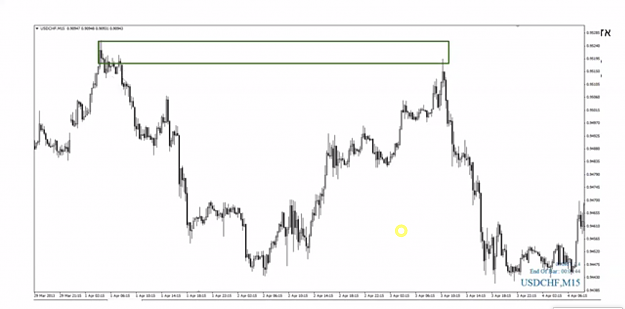
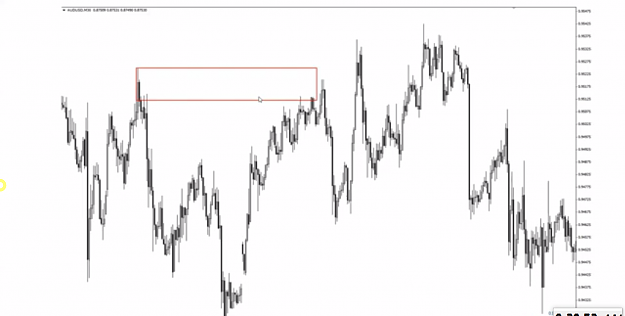
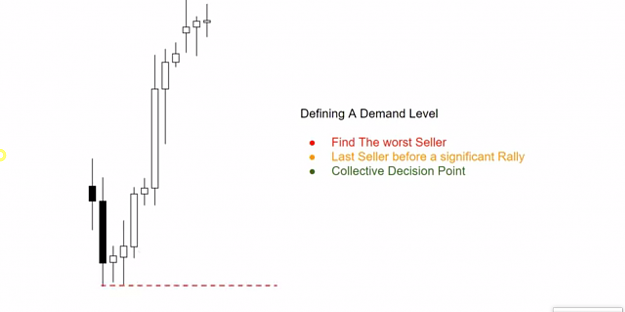
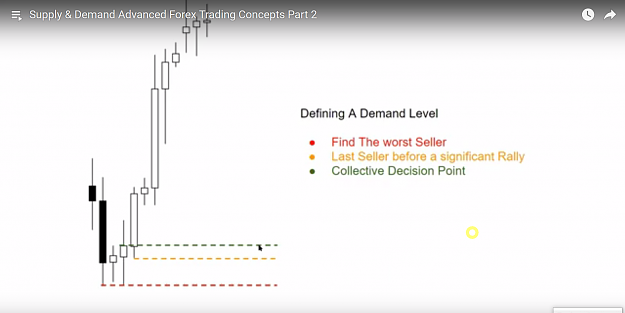
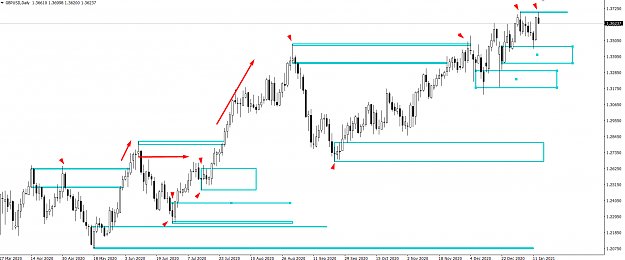
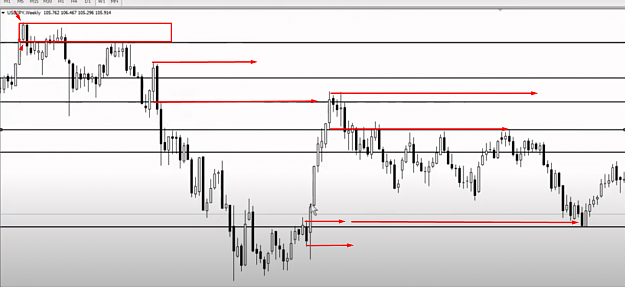
cja mate you are right you though right way highest high-lowest low with little tweak please check( ATTACHED IMAGE ALL LOGIC ) it is based on logic to draw supply demand decision point and i do manually and you also help me a lot in past . if it is possible create indicator exact image or just highest high ,lowest low to catch impulse move , buy-sell decision or price departure zone . one image is better than 100 words. i am eagerly waiting see another great creation . thanks in advance.
###to avoid a lot of zone we must consider price break previous high-low (this my idea i believe you also have some better idea)

gbp usd i drew manually break previous high-low or equal /double top-bottom. See how smart money visit/revisit to trick ,trap deceive us .
idea is stupid but logical
if possible exact image than ok or 50%(as i draw manually zone though i am not show/drew)
Attached Image(s) (click to enlarge)
Click to Enlarge

Name: DEFINING SUPPLY LEVEL 1.png
Size: 279 KB
Click to Enlarge

Name: DEFINING SUPPLY LEVEL SEEL NEXT TIME 2.png
Size: 296 KB
Click to Enlarge

Name: DEFINING SUPPLY LEVEL SEEL NEXT TIME CEX 3.png
Size: 439 KB
Click to Enlarge

Name: DEFINING SUPPLY LEVEL strong level to sell if break last dz 7.png
Size: 435 KB
Click to Enlarge

Name: DEMAND ZONE DECESION POINT DRAW 1.png
Size: 263 KB
Click to Enlarge

Name: DEMAND ZONE DECESION POINT DRAW BUY NEXT TIME IF PRICE VISIT 2.png
Size: 334 KB
Click to Enlarge

Name: gbp usd manual 1.png
Size: 59 KB
Say something meaningful or Silence!!
 
2
  • Post #43,203
  • Quote
  • Jan 13, 2021 1:35pm Jan 13, 2021 1:35pm
  •  Koal
  • | Joined Jan 2015 | Status: Member | 5 Posts
Hi, I would like to ask local masters to add a notification to the indicator ... thank you very much

https://www.mql5.com/en/code/7116
 
 
  • Post #43,204
  • Quote
  • Jan 13, 2021 1:45pm Jan 13, 2021 1:45pm
  •  hktaukhua
  • | Joined Nov 2020 | Status: Member | 82 Posts
Could some one move buffers of this indicator to color tab ?
Thank you so much.
Attached File(s)
File Type: mq4 rsi_triplehull_col_turbo-alerts-arrows_v1.01(Bullforyou.com).mq4   10 KB | 201 downloads
 
 
  • Post #43,205
  • Quote
  • Jan 13, 2021 1:45pm Jan 13, 2021 1:45pm
  •  Bankpips
  • | Joined Mar 2012 | Status: Member | 83 Posts
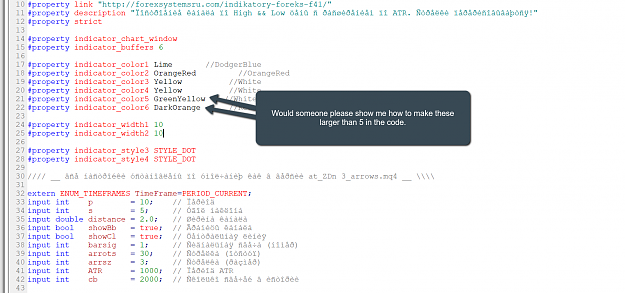
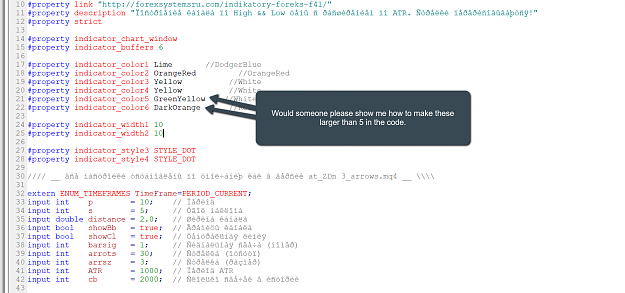
can someone please tell me how I can make 5 and 6 larger in the code
Attached Image (click to enlarge)
Click to Enlarge

Name: Code.png
Size: 132 KB
 
 
  • Post #43,206
  • Quote
  • Jan 13, 2021 1:48pm Jan 13, 2021 1:48pm
  •  Bankpips
  • | Joined Mar 2012 | Status: Member | 83 Posts
Here is the source code
Attached File(s)
File Type: mq4 Experimental ATR HiLO Channel Arrows.mq4   14 KB | 243 downloads
 
 
  • Post #43,207
  • Quote
  • Jan 13, 2021 1:49pm Jan 13, 2021 1:49pm
  •  Bankpips
  • | Joined Mar 2012 | Status: Member | 83 Posts
Thanks in advance
 
 
  • Post #43,208
  • Quote
  • Jan 13, 2021 2:58pm Jan 13, 2021 2:58pm
  •  modanetfx
  • | Joined Sep 2014 | Status: Member | 47 Posts
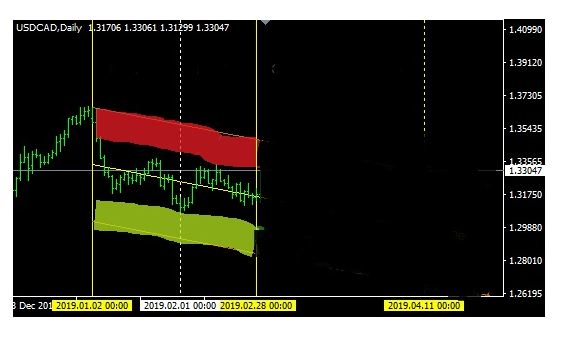
Happy and prosperous new year to you all coders and all traders in the house. Please i have this indicator that does not update its signal unless i click on indicator list, and bring it out, click ok, before the arrows can show up, i believe there could be some errors that is not allowing auto update, for the arrows to pop up at the appropriate time. Kindly help me to check the indicator and correct whatever error that is hindering the arrows to come up on chart on all time frame. Thanking you in advance for your precious time.
Attached File(s)
File Type: mq4 #Momentum onChartSignals Indicator v1.0.mq4   7 KB | 156 downloads
 
 
  • Post #43,209
  • Quote
  • Edited 5:09pm Jan 13, 2021 4:02pm | Edited 5:09pm
  •  bojack34
  • Joined Mar 2017 | Status: Member | 2,040 Posts
Could someone possibly fix this indicator so that it ONLY shows the last day if you choose 1 for "days used" I would like for it to ONLY show the day before. Currently if you use this indicator on Monday then you have to select 3 days back to account for the weekend, but by the time you get out to Wed it's showing all 3 days. I would like to be able to use this indicator and be able to select 1 and ONLY see the previous day's close....regardless if it's on a Monday or a Thursday. If it's a Monday and I have selected 1 day back, it should show Friday's Close price. Also if possible please remove the line that always appears on the chart for the current day upcoming candle close. I'm just trying to clean up the chart and not have so many unnecessary lines. TYVM

PS.......If it happens to be one of you amazing coders that knows how to add a "on/off" button to it, that would be much appreciated if you could add that to it. Not a big deal though, only if you are feeling extra generous with your time. TYVM!

Attached File(s)
File Type: mq4 TimeLineOpenClose_v1.02.mq4   7 KB | 155 downloads
 
 
  • Post #43,210
  • Quote
  • Edited 11:07pm Jan 13, 2021 4:39pm | Edited 11:07pm
  •  cja
  • Joined Feb 2007 | Status: Member | 1,894 Posts
Quoting classy
Disliked
{quote} cja mate you are right you though right way highest high-lowest low with little tweak please check( ATTACHED IMAGE ALL LOGIC ) it is based on logic to draw supply demand decision point and i do manually and you also help me a lot in past . if it is possible create indicator exact image or just highest high ,lowest low to catch impulse move , buy-sell decision or price departure zone . one image is better than 100 words. i am eagerly waiting see another great creation . thanks in advance. ###to avoid a lot of zone we must consider price break...
Ignored
Drawing the areas manually on historical charts is fine but it appears to me what you are basically asking for is a non repaint zigzag which when it turns it is a solid non repainting signal? Realistically you are basically asking for the holy grail. There are a whole lot of indicators that use highest highs lowest lows and historically they look fantastic but on a live feed are virtually impossible to trade. The best support and resistance I believe are the lines you draw manually off the higher timeframes. I will have a look through my data base and check out all the support/resistance indicators I have and see if any of them approach what I do manually.
Trade what you see not what you hope
 
3
  • Post #43,211
  • Quote
  • Jan 13, 2021 5:51pm Jan 13, 2021 5:51pm
  •  Speelmar
  • | Joined Aug 2020 | Status: Junior Member | 2 Posts
Quoting jeanlouie
Disliked
{quote} 0.0 Finger crossed try this, is there any error msg? on a normal live chart the msgs are in the experts tab of the terminal. I recall you used 2 day mtf on a 15min chart, I used that for the gif. {image} {file}
Ignored
Hi there jeanlouie thanks for your amazing post and coding, can you edit this indicator for the color codes to start when the regression starts as well, and not to extend?

And the regression moves as the price moves. Something like in the images.


Thanks in advance
Attached Image
 
 
  • Post #43,212
  • Quote
  • Jan 13, 2021 11:00pm Jan 13, 2021 11:00pm
  •  classy
  • Joined Jun 2012 | Status: Trader , Analyst and Mentor | 4,580 Posts
Quoting cja
Disliked
{quote} Drawing the areas manually on historical charts is fine but it appears to me what you are basically asking for is a non repaint zigzag which when it turns it is a solid non repainting signal? Realistically you are basically asking for the holy grail. There are a whole lot of indicators that use highest highs lowest lows and historically they look fantastic but on a live feed and are virtually impossible to trade. The best support and resistance I believe are the lines you draw manually off the higher timeframes. I will have a look through...
Ignored
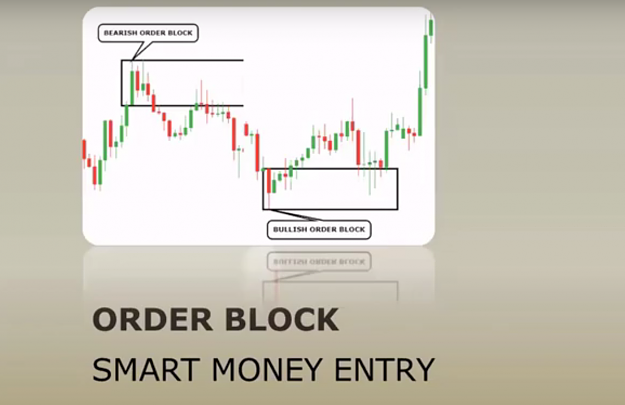
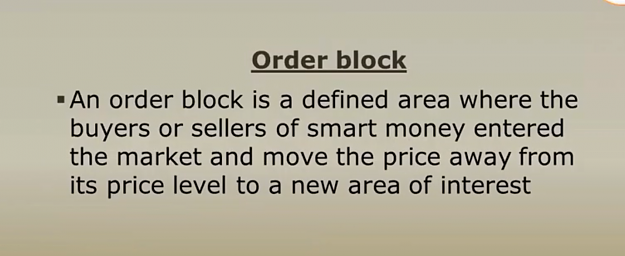
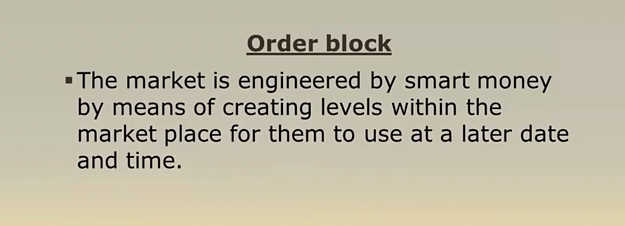
this is ict bullish bearish order block which i am looking for a long time but my bad luck may be i cant express though i attached a lot of image many time one more try if you search google or you tube you will be find a ton post /image article but not indicator may be it is possible to code, i don't know. one more try with details along with image.
Attached Image(s) (click to enlarge)
Click to Enlarge

Name: ordb cja 1.png
Size: 382 KB
Click to Enlarge

Name: ordb cja 2.png
Size: 625 KB
Click to Enlarge

Name: ordb cja 3.png
Size: 498 KB
Click to Enlarge

Name: ordb cja 4.png
Size: 546 KB
Click to Enlarge

Name: ordb cja bu ordb 5.png
Size: 419 KB
Click to Enlarge

Name: ordb cja bu ordb be ordb 6.png
Size: 444 KB
Say something meaningful or Silence!!
 
2
  • Post #43,213
  • Quote
  • Jan 13, 2021 11:17pm Jan 13, 2021 11:17pm
  •  cja
  • Joined Feb 2007 | Status: Member | 1,894 Posts
Quoting classy
Disliked
{quote} this is ict bullish bearish order block which i am looking for a long time but my bad luck may be i cant express though i attached a lot of image many time one more try if you search google or you tube you will be find a ton post /image article but not indicator may be it is possible to code, i don't know. one more try with details along with image. {image} {image} {image} {image} {image} {image}
Ignored
OK so what actually determines a Bullish/Bearish order block?? You can post all the charts historically showing Bullish/Bearish moves as you like but it does not mean anything. I can look at a chart historically and mark all the bullish/bearish moves but what specific pattern/sequence validates a signal on a live Market feed?
As I said previously take zigzag for example, I can show you every Bullish/Bearish move on a historical chart with zigzag loaded on it but try and trade those moves as they are forming live??
Trade what you see not what you hope
 
 
  • Post #43,214
  • Quote
  • Jan 13, 2021 11:48pm Jan 13, 2021 11:48pm
  •  classy
  • Joined Jun 2012 | Status: Trader , Analyst and Mentor | 4,580 Posts
Quoting cja
Disliked
{quote} OK so what actually determines a Bullish/Bearish order block?? You can post all the charts historically showing Bullish/Bearish moves as you like but it does not mean anything. I can look at a chart historically and mark all the bullish/bearish moves but what specific pattern/sequence validates a signal on a live Market feed? As I said previously take zigzag for example, I can show you every Bullish/Bearish move on a historical chart with zigzag loaded on it but try and trade those moves as they are forming live??
Ignored
i have zero knowledge about coding as far i understand zigzag or fractal catch every swing/fractal but order block catch impulse move that mean if price break previous high-low or equal high low which is the main criterion of order lock and differ from zigzag /fractal/swing. you can seee attached image how horizontal draw last green candle before go down and red candle before go up .i st image only horizontal line and 2nd image orderblock (manually) i don't want you bother you more . many many thanks for your time.

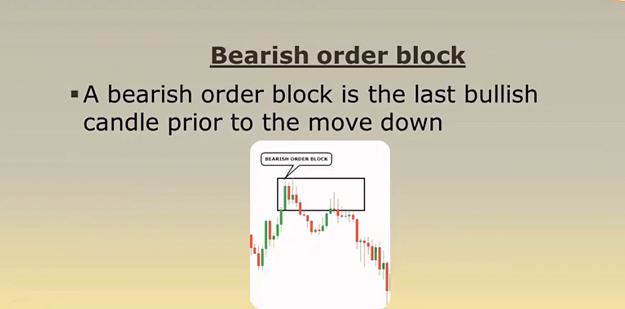
bearish order block=last green candle before go down and (draw h line last green candle high to low and extend right)
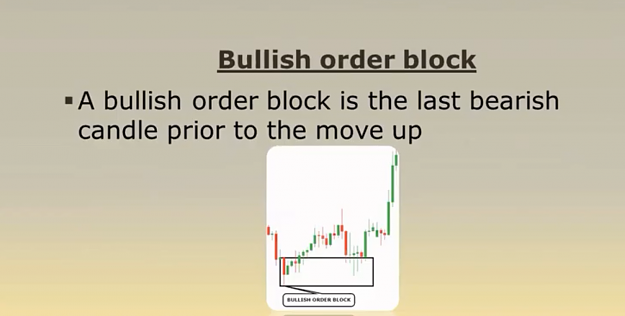
bullish red candle before go up (draw h line candle low to high and extend to right))
double top-bottom touch/break/reject/bounce
Attached Image(s) (click to enlarge)
Click to Enlarge

Name: just line  1.png
Size: 340 KB
Click to Enlarge

Name: just line  2.png
Size: 332 KB
Say something meaningful or Silence!!
 
1
  • Post #43,215
  • Quote
  • Jan 14, 2021 1:59am Jan 14, 2021 1:59am
  •  fullaforex
  • Joined Mar 2015 | Status: Member | 113 Posts
Quoting hktaukhua
Disliked
Could some one move buffers of this indicator to color tab ? Thank you so much. {file}
Ignored
Hope this is what you wanted....
Fulla

Attached File(s)
File Type: mq4 rsi_triplehull_col_turboMOD.mq4   11 KB | 232 downloads
 
 
  • Post #43,216
  • Quote
  • Jan 14, 2021 2:24am Jan 14, 2021 2:24am
  •  fullaforex
  • Joined Mar 2015 | Status: Member | 113 Posts
Quoting Bankpips
Disliked
can someone please tell me how I can make 5 and 6 larger in the code{image}
Ignored
Attached Image

If #property indicator_width1 10 and #property indicator_width2 10 works, do the same for 5 and 6.
ie;
#property indicator_width5 10
#property indicator_width6 10
 
 
  • Post #43,217
  • Quote
  • Jan 14, 2021 2:45am Jan 14, 2021 2:45am
  •  hktaukhua
  • | Joined Nov 2020 | Status: Member | 82 Posts
Quoting fullaforex
Disliked
{quote} {image} If #property indicator_width1 10 and #property indicator_width2 10 works, do the same for 5 and 6. ie; #property indicator_width5 10 #property indicator_width6 10
Ignored
hello!
Thank you so much but the buffer still there .
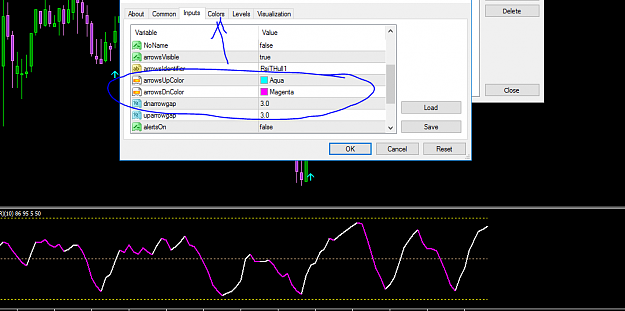
This is what i need
Attached Image (click to enlarge)
Click to Enlarge

Name: i need this.PNG
Size: 35 KB
 
 
  • Post #43,218
  • Quote
  • Jan 14, 2021 3:18am Jan 14, 2021 3:18am
  •  fullaforex
  • Joined Mar 2015 | Status: Member | 113 Posts
Quoting hktaukhua
Disliked
{quote} hello! Thank you so much but the buffer still there . This is what i need {image}
Ignored
They are not using buffers. They are generated by a "draw arrow" fuction.. That's why are are where they are.
It would be helpful if you explain exactly what you want so you don't waste peoples time.
 
 
  • Post #43,219
  • Quote
  • Jan 14, 2021 3:32am Jan 14, 2021 3:32am
  •  hktaukhua
  • | Joined Nov 2020 | Status: Member | 82 Posts
Quoting fullaforex
Disliked
{quote} They are not using buffers. They are generated by a "draw arrow" fuction.. That's why are are where they are. It would be helpful if you explain exactly what you want so you don't waste peoples time.
Ignored
So i want to made 2 arrows like that arrow.
Could you make it be buffers?
Make sure it on color tab and will not repaint
 
 
  • Post #43,220
  • Quote
  • Jan 14, 2021 3:59am Jan 14, 2021 3:59am
  •  jeanlouie
  • Joined Dec 2010 | Status: Member | 1,418 Posts
Quoting Speelmar
Disliked
{quote} ... can you edit this indicator for the color codes to start when the regression starts as well, and not to extend? And the regression moves as the price moves. Something like in the images...
Ignored
Linear_Regression_Lines_auto_mtf_v1.21
- filled channel starts from start of period used
- all lines n channels have projection optoin

on default
Attached Image

with projections and labels off, and including the live bar
Attached Image
Attached File(s)
File Type: ex4 Linear_Regression_Lines_auto_v1.21.ex4   75 KB | 241 downloads
 
4
  • Platform Tech
  • /
  • I will code your EAs and Indicators for no charge
  • Reply to Thread
    • 1 21592160Page 216121622163 2916
    • 1 Page 2161 2916
27 traders viewing now, 4 are members:
roma23
,
solorik
,
llJustll
,
Nits
  • More
Top of Page
  • Facebook
  • Twitter
About FF
  • Mission
  • Products
  • User Guide
  • Media Kit
  • Blog
  • Contact
FF Products
  • Forums
  • Trades
  • Calendar
  • News
  • Market
  • Brokers
  • Trade Explorer
FF Website
  • Homepage
  • Search
  • Members
  • Report a Bug
Follow FF
  • Facebook
  • Twitter

FF Sister Sites:

  • Metals Mine
  • Energy EXCH
  • Crypto Craft

Forex Factory® is a brand of Fair Economy, Inc.

Terms of Service / ©2023