I am a big fan of RSI trading and I couldn't find what I was looking for.
So, I created an RSI MTF scanner ..
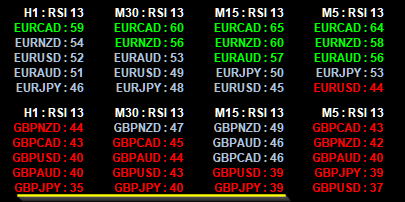
Let me introduce my RSI Scanner.
1. You can enable/disable any time frame
2. You can set own RSI period ( default 14 )
3. You can set own Oversold/Overbought value ( default 30/70)
4. You can use own list of pairs or use default auto list.
if RSI value is crossing overbought/oversold area, RSI value will be marked with box.
it will show B or S depending on where RSI value is crossing.
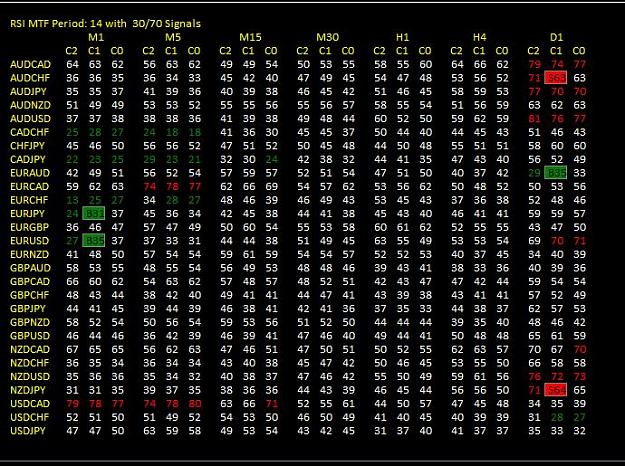
It shows Candle C2,C1,C0 RSI values so you can read how it trends lately on each time frame.
if values are under oversold, it will be shown as green colored value
if values are above overbought, it will be shown as red colored value
Few other options.
Updated: Just added option to change applied_price. I use typical_price, but I thought it would be good to have other option. if you downloaded already, please download again. it has one more option to change which applied_price to use.
I am a big fan of RSI trading and I couldn't find what I was looking for. So, I created an RSI MTF scanner .. Let me introduce my RSI Scanner. 1. You can enable/disable any time frame 2. You can set own RSI period ( default 14 ) 3. You can set own Oversold/Overbought value ( default 30/70) 4. You can use own list of pairs or use default auto list. if RSI value is crossing overbought/oversold area, RSI value will be marked with box. it will show B or S depending on where RSI value is crossing. It shows Candle C2,C1,C0 RSI values so you can read how...
Ignored
Hi thank you,
Tested on 2 platforms and the two are now freezed
{quote} Hi thank you, Tested on 2 platforms and the two are now freezed
Ignored
Freezed? Can you give me a bit more info?
it should refresh every 30 sec by default and uses little CPU resources in my setting.
It is just a lot of iRSI function calls, no external indicator calls included.
{quote} Freezed? Can you give me a bit more info? it should refresh every 30 sec by default and uses little CPU resources in my setting. It is just a lot of iRSI function calls, no external indicator calls included.
Ignored
Thanks for the effort, you are appreciated.
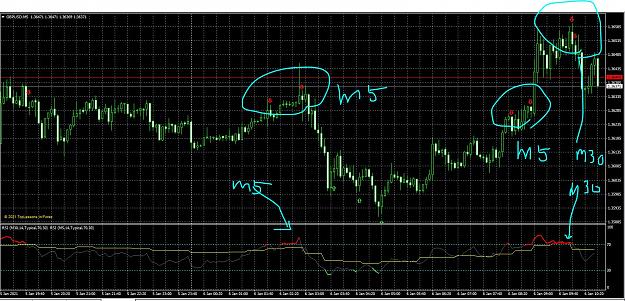
Please, can you take it further by creating something like the below image
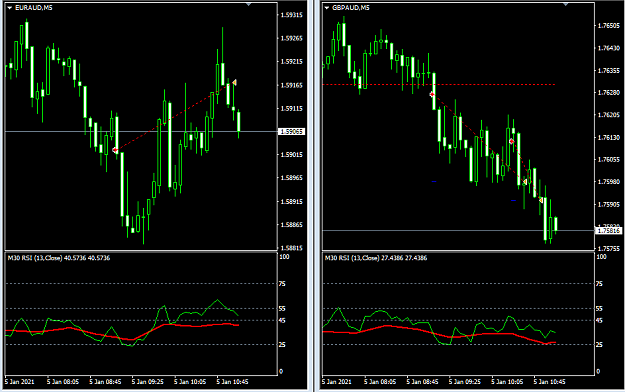
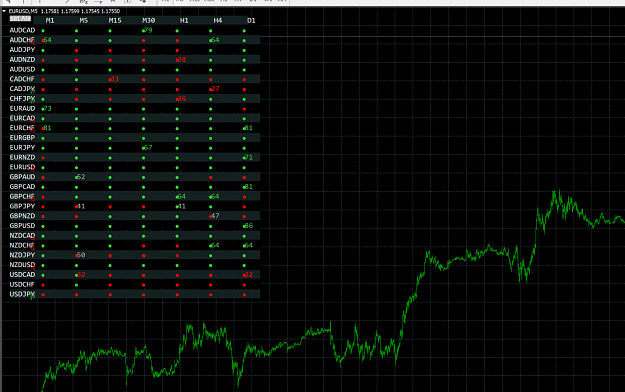
{quote} Can you explain what are those dots and numbers?
Ignored
The Red dots represent downward movement and the green dots represent upwards movement.
For the numbers I am not sure what they represent but I think the rsi of 30/70 may replace that
I am a big fan of RSI trading and I couldn't find what I was looking for. So, I created an RSI MTF scanner .. Let me introduce my RSI Scanner. {file}
Ignored
Hi BlueRain,
do you think it's possible to do the following RSI alert?
appreciate your time and effort looking into it.
for example, mtf rsi, m30 and m5.
upon the higher time frame candle closed when rsi is below 45 (optional), a sell arrow alert appears on the higher and lower time frame charts.
upon the higher time frame candle closed when rsi is above 55 (optional), a buy arrow alert appears on the higher and lower time frame charts.
{quote} Hi BlueRain, do you think it's possible to do the following RSI alert? appreciate your time and effort looking into it. for example, mtf rsi, m30 and m5. upon the higher time frame candle closed when rsi is below 45 (optional), a sell arrow alert appears on the higher and lower time frame charts. upon the higher time frame candle closed when rsi is above 55 (optional), a buy arrow alert appears on the higher and lower time frame charts. {image}
Ignored
Isn't this alert already in "RSI Color with Alert"?
You just have to drop 2 indicator - and set the level.
{quote} The Red dots represent downward movement and the green dots represent upwards movement. For the numbers I am not sure what they represent but I think the rsi of 30/70 may replace that
Ignored
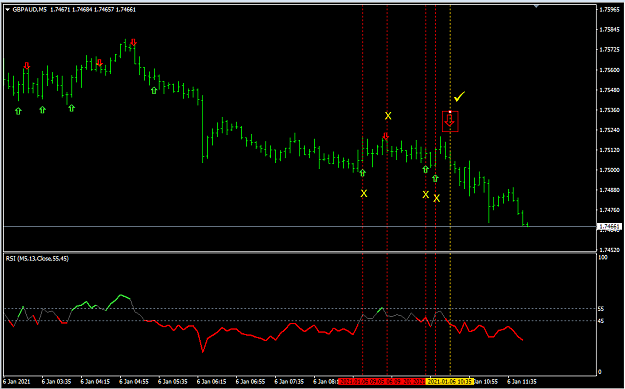
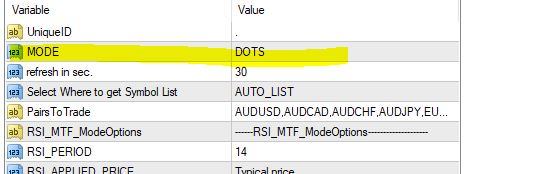
Please find V1.55 which I have added "MODE" as option.
Default MODE is NUMBERS but you can change to DOTS in options.
Attached Image
once you set mode to DOTS, it will display trend as dots.
Where Green dot is uptrend ( means RSI is rising ), and Red dot is downtrend ( means RSI is falling)
Each C2,C1,C0 will compare value with previous bar and it will display dots accordingly.
Numeric value is only shown when RSI value is crossing oversold/overbought line which you can set in option.
example:
S68 means RSI value is falling and crossed from above 70 to below 70. Sell.
B32 means RSI value is rising and crossed from below 30 to above 30. Buy.
Attached Image
If you want both displayed at the same chart, you just have to drop two indicators but with own unique id.
example: unique Id for 2nd indicator set to 1.
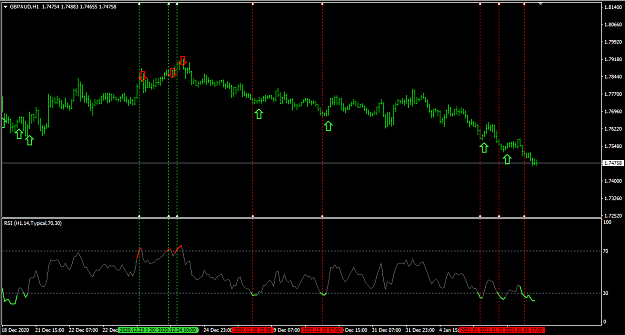
{quote} Isn't this alert already in "RSI Color with Alert"? You just have to drop 2 indicator - and set the level. {image} {file}
Ignored
the thing is that i do not trade rsi as overbought/oversold indicator.
instead i use rsi as a momentum indicator, meaning when rsi below level 45 is sell, when rsi above level 55, is buy.
is it possible to reverse the arrow signal according to the chart with the ticked arrow?
thanks.
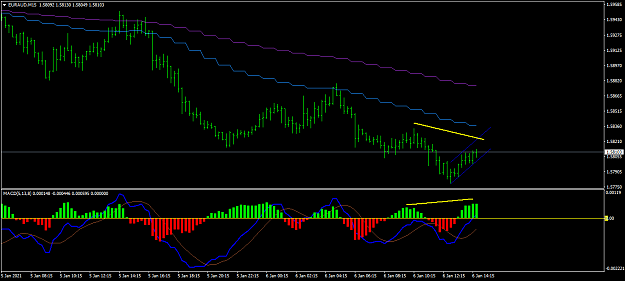
{quote} the thing is that i do not trade rsi as overbought/oversold indicator. instead i use rsi as a momentum indicator, meaning when rsi below level 45 is sell, when rsi above level 55, is buy. is it possible to reverse the arrow signal according to the chart with the ticked arrow? thanks. {image}
Ignored
Please use modified indicator.
I have added 3 new options:
extern bool showArrows = true; extern int UpArrowSymbol = 242;
extern int DownArrowSymbol = 241;
extern int ArrowSize = 3;
you can change or switch those arrow symbol numbers for your own settings.
Also, you can adjust arrowsize to meet your settings.
if needed, you may provide your own symbol as indicator symbols instead of arrow.
As you already know, those are "Winding" fonts which you can easily find what those numbers are from search.
For your 55,45 alert lines, you can set those as Overbought,Oversold value and I think it will work for you.
My OCD notes that the list is not alphabetically correct
Ignored
Is this regarding list of RSI scanner?
There is two options - AUTO_List and USER_LIST
AUTO_LIST will pickup whatever in your pair list displayed on MT4.
USER_LIST will use list you can provide in the option.
i think i did not properly convey what was wanted to you.
i will try again.
i am using the default rsi as per the chart.
the arrows appearing are not what i wanted.
i would like to see an upward pointing green arrows on the green vertical dotted lines when the rsi crossed above level 70.
and a downward pointing red arrows on the red vertical dotted lines when the rsi crossed below level 30.
then when in actual use, i will change the level to rsi above 55 for buying (instead of 70) and below 45 for selling (instead of 30).