Hi Team,
I wanted to share a brand-new trend following trading strategy with you. The majority of my trades are trend following, and I love finding value with pull backs trades.
This strategy is 100 PERCENT RULE BASED and only uses 2 INDICATORS. The first is my OGT Pivot Points Indicator (download below) which uses daily pivots, support and resistance 1 levels. The second is the Bill Williams Fractals Indicator (standard with MT4) which gives us confirmation of the pull back reversal.
The tutorial video walks through all the indicator settings and entry rules.
I also walk through chart examples of trade setups, entries, stop loss and take profit target.
Strategy Rules:
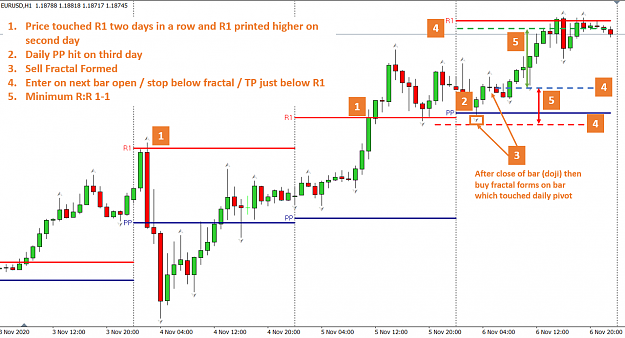
1. Two consecutive days R1/S1 touched and made new high/lows
2. Next day - wait for price to hit daily pivot
3. If daily pivot not hit, go back to step 1
4. When daily pivot hit - wait for buy/sell fractal to form
5. Enter position - TP: S1/R1 SL: above/below fractal
6. Minimum reward to risk 1:1
I recorded the video last week, but there was a great setup on the EUR/USD on Friday which has a screenshot below with commentary to walk you through the strategy. It may look complicated, trust me it’s really easy to understand. I suggest watching the video as I go into another trading example.
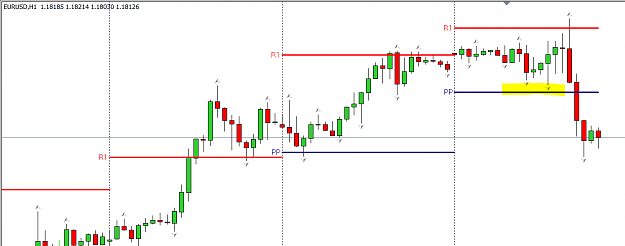
What is also great is that for the EUR/USD has a potential setup for Monday. R1 has been hit the last two days (Thurs/Fri) and has been consecutively higher. What we are now waiting for is for price to retrace to the Monday’s daily pivot.
I wanted to share a brand-new trend following trading strategy with you. The majority of my trades are trend following, and I love finding value with pull backs trades.
This strategy is 100 PERCENT RULE BASED and only uses 2 INDICATORS. The first is my OGT Pivot Points Indicator (download below) which uses daily pivots, support and resistance 1 levels. The second is the Bill Williams Fractals Indicator (standard with MT4) which gives us confirmation of the pull back reversal.
The tutorial video walks through all the indicator settings and entry rules.
Inserted Video
I also walk through chart examples of trade setups, entries, stop loss and take profit target.
Strategy Rules:
1. Two consecutive days R1/S1 touched and made new high/lows
2. Next day - wait for price to hit daily pivot
3. If daily pivot not hit, go back to step 1
4. When daily pivot hit - wait for buy/sell fractal to form
5. Enter position - TP: S1/R1 SL: above/below fractal
6. Minimum reward to risk 1:1
I recorded the video last week, but there was a great setup on the EUR/USD on Friday which has a screenshot below with commentary to walk you through the strategy. It may look complicated, trust me it’s really easy to understand. I suggest watching the video as I go into another trading example.
Attached Image (click to enlarge)
What is also great is that for the EUR/USD has a potential setup for Monday. R1 has been hit the last two days (Thurs/Fri) and has been consecutively higher. What we are now waiting for is for price to retrace to the Monday’s daily pivot.
Attached File(s)
Never stop investing. Never stop improving. Never stop doing something new