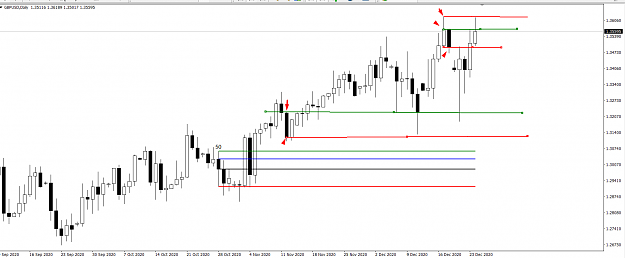
{quote} If a candle o/h/l/c is above a 50ema, then trend is up. If a candle o/h/l/c is below a 50ema, then trend is down. done, if you code at all the above is all you need.
Ignored
But its not just that is. Like, price, even if in an uptrend, sometimes goes under the EMA50, it doesnt mean the trend shifted tho, and it may cost me money if there is, in theory, for the bot, a seel opportunity, which is not valid cause we are dealing with an uptrend, you seee what i mean?
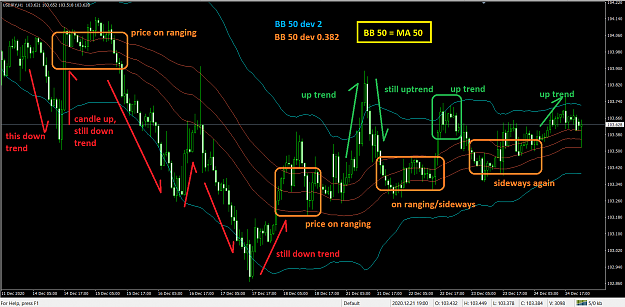
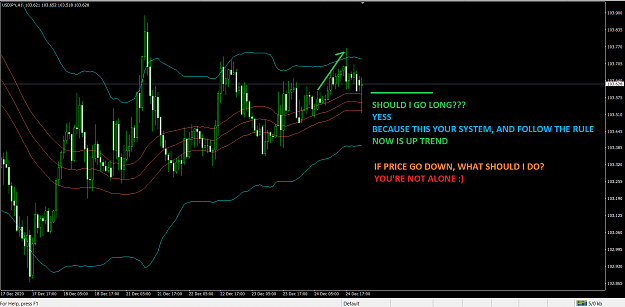
But anyways, can anyone code for something very simple. It is applied for all the tf available in the platform, and basicly, everytime theeree is a candle that closes above the Top Band of Bollinger Bands, the EA opens a opsition when price touches a Moving Average (method: Linear Weighted, applied to: Low, period: 5). And then, another bot that is exactly the same but for sell, so now the candle should close below Lower Band and opens a position when price touches the same MA but this time applied to: High???
Cause my idea now is instead of making a fully automated EA, everyday i'll check thee trend we are at and then i'll choose which EA to use, the buy or sell one.
{quote} But its not just that is. Like, price, even if in an uptrend, sometimes goes under the EMA50, it doesnt mean the trend shifted tho, and it may cost me money if there is, in theory, for the bot, a seel opportunity, which is not valid cause we are dealing with an uptrend, you seee what i mean?
Ignored
"sometimes goes under the EMA50, it doesnt mean the trend shifted tho"
- yeah well, that's the definition you gave
"it may cost me money"
- yeah well, that's the definition you gave
"you seee what i mean? "
- you wanted to define trend in code, I asked you how you would define trend in the first place, apparently using your own definition is not good enough by your own standard, you're just realizing that, or you perhaps just gave an off the cuff answer without much thought
But dude like there is no way you think im wrong, if i tell you that i define a trend with the EMA50 the way i just described, you know price can go under EMA50 for a few candles, wich can be literaly days, and it doesnt mean the trend shifted but means imma lose money with scalps
But dude like there is no way you think im wrong, if i tell you that i define a trend with the EMA50 the way i just described, you know price can go under EMA50 for a few candles, wich can be literaly days, and it doesnt mean the trend shifted but means imma lose money with scalps
Ignored
However you define trend is up to you, and as for my earlier question, that's the answer you gave, whether it was a serious answer or not is beside the point that it's still the answer you gave. Give answers that at least meet your own standard.
Why would I think you're wrong? Plenty of serious traders define trend just as simply.
{quote} it will help then {quote} I can't help you, no author in that indicator bro {image} {image} {file}
Ignored
One last request and it will be exactly what is needed. First off, give the option to NOT use certain lines. That way if we ONLY want to use the CLOSE....we can. Also, instead of choosing how many bars "back" for the OHLC lines, can you instead use GMT time? I'm trying to find an indicator that will plot the Candle Close of any candle I choose.....for example. If I want to use the LONDON CLOSE price, it will plot a horizontal line at that time everyday. With the current indicator everything is in the past for our selections. If we can use GMT time it will be universal and we can then select which candles are used everyday in advance. TYVM for your time and skills!
{quote} One last request and it will be exactly what is needed. First off, give the option to NOT use certain lines. That way if we ONLY want to use the CLOSE....we can. Also, instead of choosing how many bars "back" for the OHLC lines, can you instead use GMT time? I'm trying to find an indicator that will plot the Candle Close of any candle I choose.....for example. If I want to use the LONDON CLOSE price, it will plot a horizontal line at that time everyday. With the current indicator everything is in the past for our selections. If we can use...
Ignored
Please permit me to add one more option
Pop up sound Alert system on lines it will help to know when there's re-touch i think
{quote} One last request and it will be exactly what is needed. First off, give the option to NOT use certain lines. That way if we ONLY want to use the CLOSE....we can. Also, instead of choosing how many bars "back" for the OHLC lines, can you instead use GMT time? I'm trying to find an indicator that will plot the Candle Close of any candle I choose.....for example. If I want to use the LONDON CLOSE price, it will plot a horizontal line at that time everyday. With the current indicator everything is in the past for our selections. If we can use...
{quote} hi mate is it possible code indicator or script to move lines and fit/place to any any candle open -high-low-close(attached image) please {image}
Ignored
your quotes exactly the indicator on that post can do, see the pictures
This is perfect....but.....lol.......for some reason the indicator is not changing the last day horizontal line. For example if I change the candle time to 19:00 and use Close......it changes everything perfectly except for the last day. It's staying on 08:00 no matter what. Other than that minor bug, it's perfect. Can you possibly add a "magic number" incase we want to run more than one instance. TYVM! Looks great!
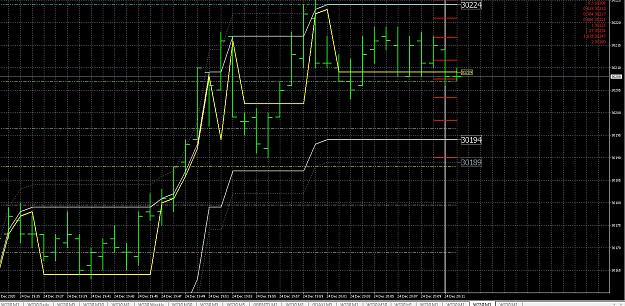
{quote} hello Guys! I have a problem with this indicator and need someone fix it. Some signal of this indicator can trade but some can't automatic trading intrabar. Maybe because lag or something like that. {file}
Ignored
Can someone explain why i can't get all signals of this indicator?
some signal show arrow and take a trade and some only show arrow and can't trade at that candle
i'm using automatic trading for this indicator but can't get all signals from it
{quote} This is perfect....but.....lol.......for some reason the indicator is not changing the last day horizontal line. For example if I change the candle time to 19:00 and use Close......it changes everything perfectly except for the last day. It's staying on 08:00 no matter what. Other than that minor bug, it's perfect. Can you possibly add a "magic number" incase we want to run more than one instance. TYVM! Looks great!
Ignored
my bad, All fix. enjoy bro .. I added UniqueID for using more than one.. just change the text value
But anyways, can anyone code for something very simple. It is applied for all the tf available in the platform, and basicly, everytime theeree is a candle that closes above the Top Band of Bollinger Bands, the EA opens a opsition when price touches a Moving Average (method: Linear Weighted, applied to: Low, period: 5). And then, another bot that is exactly the same but for sell, so now the candle should close below Lower Band and opens a position when price touches the same MA but this time applied to: High??? Cause my idea now is instead of making...
Guys how do you define a trend with code? I can't seem to figure out how to go about it when price is ranging (consolidated). Any tips?
Ignored
Rangging is good as it gives us hint that price will go further soon. but the issues is Long or Short?
try to use 3zzz semafor. try search in this thread. it can give you something in identifying the trend. make sure the semafor is fixed because it will keep updating when new highest/lowest occurs. for 3rd semafor use setting = 65. this semafor is not for trigger but for identifying the trend unless you use several filters when 3rd semafor occurs that will be another story
For Timeframe based Fibo scale you have done quite an useful FiboONecandle. I use it daily.
Can you please add a Fibo scale that can draw the Fibos from the number of previous bars defined but treating Middle Line of the Pips channel (also modified by you with the middle line) as the 0 base point?
I have exe file but the display format idea was derived from Ma on Vline indicator and the Fibo idea was from Fibo_v5 mq4 files of both are attached for your quick reference.
Happy Boxing Day to Everyone and specially to our great CODERS
Please I have a request, this indicator that I am going to upload bellow is an MTF indicator that has a great
prospect, but it does not load on my mt4 platforms, its the indicators in the sub-windows. I will also post the screenshot of the template. Thanks