• Home
  • Forums
  • Trades
  • News
  • Calendar
  • Market
  • Brokers
  • Login
  • Join
  • User/Email: Password:
  • 8:52pm
Menu
  • Forums
  • Trades
  • News
  • Calendar
  • Market
  • Brokers
  • Login
  • Join
  • 8:52pm
Sister Sites
  • Metals Mine
  • Energy EXCH
  • Crypto Craft

Options

Bookmark Thread

First Page First Unread Last Page Last Post

Printable Version

Similar Threads

Alarms for opening, closing positions and pending order 4 replies

Closing and Opening same trades on different accounts 0 replies

Yesterday closing line and Today Opening Line Indicator 0 replies

opening and closing trades on an EA 4 replies

True opening and closing hours? 16 replies

  • Rookie Talk
  • /
  • Reply to Thread
  • Subscribe
  • 1
Attachments: How to read opening and closing prices
Exit Attachments

How to read opening and closing prices

  • Post #1
  • Quote
  • First Post: Edited at 11:30am Feb 9, 2020 11:02am | Edited at 11:30am
  •  marwood
  • | Joined Jan 2020 | Status: Member | 14 Posts
Hi,

Can someone please explain how I should be viewing opening and closing prices on charts?
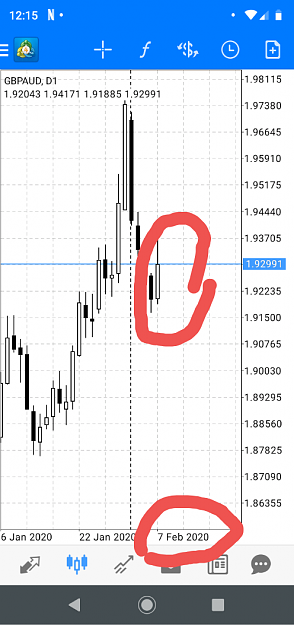
For example, GBPAUD is showing a red (bearish) candle for daily chart on 7 feb, but if I look on 7 feb 1h chart starting from 00:00 hrs to 21:00 hrs the price has risen, not dropped.
My time zone is UTC+1. For my strategy I want to determine if the daily has gone up or down.
Should I viewing trading session times? I.e., London session would be 9am - 5pm. Should I only look between those 2 time intervals?
Thanks :-)
  • Post #2
  • Quote
  • Feb 9, 2020 12:19pm Feb 9, 2020 12:19pm
  •  viptrading
  • Joined Sep 2018 | Status: Member | 333 Posts
Feb 7th was a Bullish day for GBPAUD.
That means the closing price was higher than the open, so you are reading the information incorrectly somehow. See the screenshot below.

GBPAUD DAILY CHART
Attached Image (click to enlarge)
Click to Enlarge

Name: Screenshot_20200209-121538.png
Size: 107 KB


Hope that helps.

Cheers.
  • Post #3
  • Quote
  • Feb 9, 2020 12:26pm Feb 9, 2020 12:26pm
  •  marwood
  • | Joined Jan 2020 | Status: Member | 14 Posts
It did help, prompted me to check my charts again and I just realized that I'd changed to Heikin Ashi candles this morning after watching Trading ATS on youtube. I was curious as to what the chart looked like with HA candles but had forgotten to switch back....doh!
I think they're a candle which convey an average tick movement across the day, so probably more down than up movement on 7 feb and that was what was confusing me.
Lesson learned, thanks :-)
1
  • Post #4
  • Quote
  • Feb 13, 2020 5:46pm Feb 13, 2020 5:46pm
  •  Downtheave
  • | Joined Feb 2020 | Status: Junior Member | 1 Post
I have a question too. Please help me k ow which is the correct cutoff for downloaded historical data. If I need monthly data for eurusd for the whole 2019, I select beginning date 1.1.2019. End date 12.31.2019. What I get is.
31.12.2018 17:00. -------
31.01.2019 17.00---------
28.02.2019. 17.00--------
31.03.2019. 17.00-------
30.04.2019 17.00--------
31.05.2019. 17.00--------
30.06.2019. 17.00--------
31.07.2019. 17.00-------
31.08.2019 17.00-------
30.09.2019 17.00--------
31.10.2019. 17.00------
30.11.2019. 17.00----
31.12.2019. 17.00---
Now these are 13 periods whereas I need data for the 12 months of 2019, Jan to Dec. So which ones pertain to 2019?
Similarly, if I need data for the month of january 2019, I select Jan 1 2019 and jan 31 2019. And select monthly. What I get is
31.12.2018. 17.00 -------
31.01.2019. 17.00-------
28.02.2019. 17.00---
So which of this data relates to only january 1 2019 to January 31 2019?
In the same vein if I need weekly data for the week beginning jan 1 2019 to january 8 2019 I select beginning date 01.01.2019. End date 01.08.2019 then select weekly. This is what I get
30.12.2018. 17.00----
06.01.2019. 17.00---
Does it mean the week starts on sunday and ends on sunday and which of this data then relates to the first week of january 2019?
Last one. I need data for jan 2. 2019. So I select start date 01.01.2019, end date 01.02.2019. Then I hit day. This is what comes out.
31.12.2018. 17.00. ------
01.01.2019. 17.00---
02.01.2019. 17.00--
So which of this data relates to jan 02 2019?
Please help.
  • Post #5
  • Quote
  • Feb 13, 2020 6:22pm Feb 13, 2020 6:22pm
  •  viptrading
  • Joined Sep 2018 | Status: Member | 333 Posts
Honestly Mt4 data for back-testing is kind of useless. I recommend using some third party software for good quality 99% back-testing data.

I assume you need this data for an EA you are testing? If so here's what I have to say. I've done a lot of back-testing and forward-testing with EA's, and I don't think its worth the time. The best thing to do is just run it forward either on demo or live with a small account and small lot sizes (if using live) to see if it works. This will give you a much better idea than any back-testing can.

If you do insist on back testing data for whatever reason. I recommend using Tickstory. That's what I used in the past and it is very accurate from my experience.

Hope that helps.

Cheers
  • Post #6
  • Quote
  • Dec 18, 2020 4:05pm Dec 18, 2020 4:05pm
  •  Robertstarc
  • | Additional Username | Joined Jan 2020 | 265 Posts
You need to know all the basics of forex before investing your money in this risky market.
  • Post #7
  • Quote
  • Dec 18, 2020 8:16pm Dec 18, 2020 8:16pm
  •  DeanLittler
  • | Additional Username | Joined Jul 2020 | 129 Posts
There are many types of articles and videos online that can help you get an idea of the basics.
  • Post #8
  • Quote
  • Last Post: Dec 19, 2020 12:58pm Dec 19, 2020 12:58pm
  •  Niels.Lar
  • | Additional Username | Joined Jul 2020 | 130 Posts
Support and resistance level are the best way to identify good entry and exit point.
  • Rookie Talk
  • /
  • How to read opening and closing prices
  • Reply to Thread
0 traders viewing now
Top of Page
  • Facebook
  • Twitter
About FF
  • Mission
  • Products
  • User Guide
  • Media Kit
  • Blog
  • Contact
FF Products
  • Forums
  • Trades
  • Calendar
  • News
  • Market
  • Brokers
  • Trade Explorer
FF Website
  • Homepage
  • Search
  • Members
  • Report a Bug
Follow FF
  • Facebook
  • Twitter

FF Sister Sites:

  • Metals Mine
  • Energy EXCH
  • Crypto Craft

Forex Factory® is a brand of Fair Economy, Inc.

Terms of Service / ©2021