Disliked{quote} correct if im wrong sir. you are using oanda broker which is server in moscow? and if im in indonesia what time should i put in the program? im gmt +7 here and what about the daylight setting, should i turn it off ? . thank you very much sirIgnored
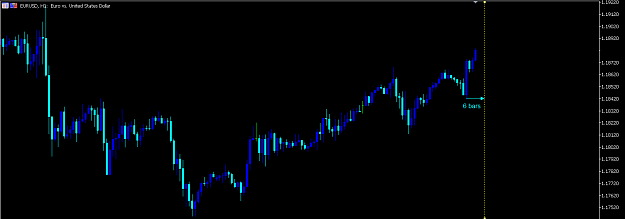
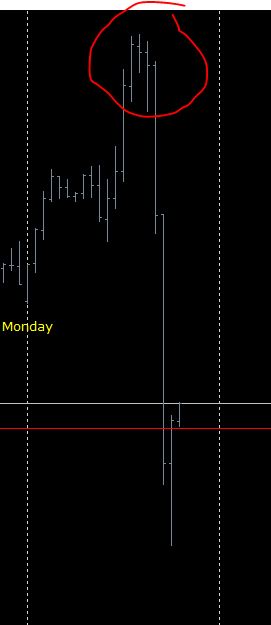
We trade from what is on the chart and that is determined by the data feed.