{quote} I am definitely inclined for the social project of Teaching Elederlies free of cost by producing videos. Can you please send a video you are talking about so can get a little insight. Thanks & Regards
Can someone please fix this indicator I found here in FF?
It's a basket trade EA to close trades once profit is reached for specific pair you attach it to.
It managed to close my basket of trades but not according to the setting I put in "Threshold for profit"
For example, I put in 5 which is $5 but the EA closed all trades at $2.
Please help.
Can you please also add the function to close pending orders once set profit is reached in that currency pair which the EA is attached?
This is what I was meaning yesterday with where I want my fib levels on the screen, on the right hand side.
See attached indicator where it prints its levels as an example.
This indicator works off ADR , I dont want that, want pure Fib levels of a price level , and I want to anchor and leave it where I want it.
If you can get this one to do that, also fine.
If you have a way to make the BoxBcBox levels also print only on right side...will be awesome !
But fibs...PLEASE
Anyone here on the forum maybe have a quarters line indicator ( 00, 25, 50, 100) , with change able line features?
Searching my ass off, cant find something so simple...lol
( maybe im just blind...lol)
{quote} Hi ganztrade, This is what I was meaning yesterday with where I want my fib levels on the screen, on the right hand side. See attached indicator where it prints its levels as an example. This indicator works off ADR , I dont want that, want pure Fib levels of a price level , and I want to anchor and leave it where I want it. If you can get this one to do that, also fine. If you have a way to make the BoxBcBox levels also print only on right side...will be awesome ! But fibs...PLEASE Anyone here on the forum maybe have a quarters line indicator...
Ignored
This itself is a very good indicator.
Everybody is trying to get something around this indicator
{quote} hi, I have a set file for a particular indicator. After copying the indicator to indicator folder, where should i copy the set files ? Can you clarify. thanks,
Ignored
MQL > Presets (folder)
you should copy that ".set" file in the "Presets" folder inside the MQL
{quote} Sorry, little bug on handling filters. Fixed the bug and updated. Also, updated original one too. {file}
Ignored
Dear BlueRain (and Lucky1359)
Would it be complicated to put the label of the day of the week left to the date ?
In any case thanks for that interesting indi.
Best
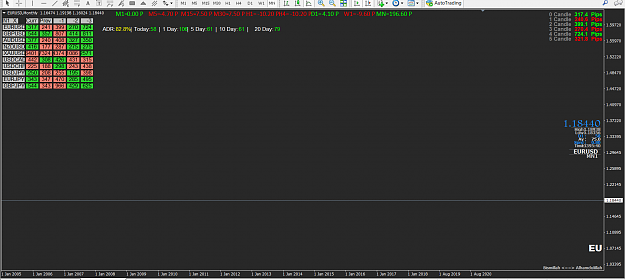
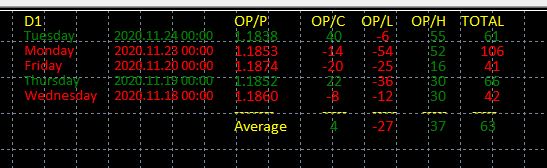
{quote} Dear Classy, The main purpose of the Table is the Statistic part of the Pips. How many pips it goes high and low in certain time-frames. {image} See H4 - 2 - 1.1842 - Its End Result after 4 Hours and Compare it with Averages - There would be something which matches with the H4 Results When you use it with your Style of Trading the Statistics part certainly helps a lot in gaining Green Pips. Please share you Trading Style so we can discuss more about it. Thanks & regards
Ignored
thanks bro , i am also watch pip moved along with level specially equal high-low. if you want know how i trade than you can catch me. what is that high-low level in you chart ? https://www.forexfactory.com/thread/...8#post13272178
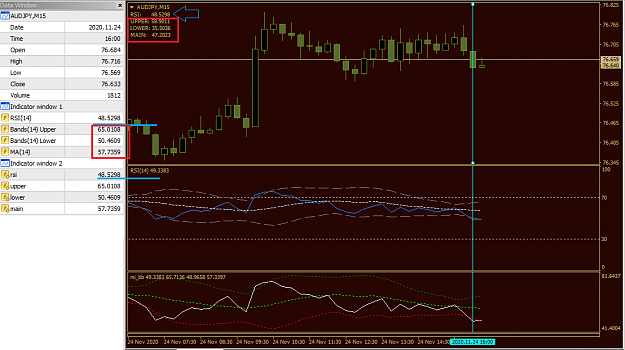
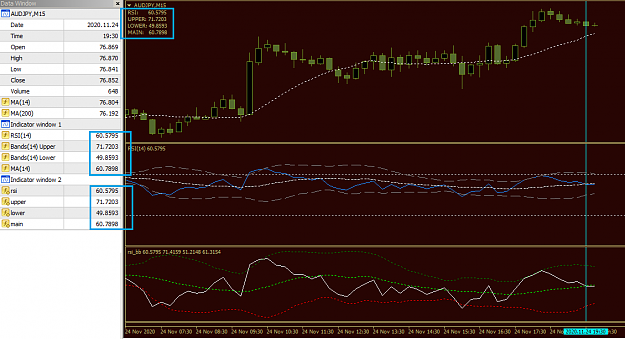
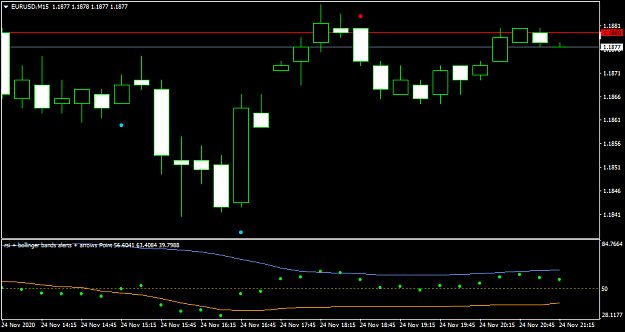
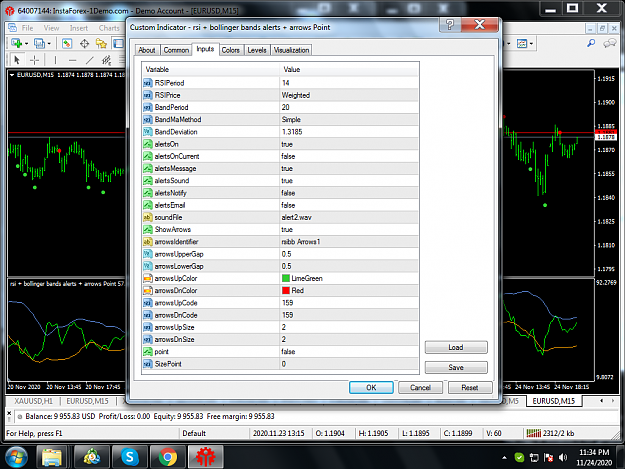
Hello all, I am trying to combine RSI and Bollinger Bands within an EA but I seem to be running into a weird problem. When I combine the default RSI with Bollinger Bands using Previous Indicator's Data or within an indicator (see attached) , I obtain the correct values.
Evidently apart from the RSI, all other values are completely wrong. I am hoping someone can help me figure out what the problem is. I have tried adjusting the size of the arrays but that does not seem to work although the values do vary slightly. I also tried ArraySetAsSeries() but ran into a wall probably because I am not entirely sure whether it is applicable here. I find this to be a rather peculiar problem working with arrays. Is anyone in a position to offer some needed guidance?
iam looking for Multichart indicator. 3 timeframe in one same chart, also can draw analisys or add indicator. 1.Multichart_s+f_edition set+forget 2.MiniCharts Gold By SB something like these. thank in advance refer: https://m.youtube.com/watch?v=ZFKrjrAKtx4 {image} {image}
Ignored
it is actually nice tool for any trader. if find please don't forget to share.thanks
Hi dear coders! I have one humble request. Can some coder add SR button to the attached SS SupportResistance indicator for ON/OFF function. The button should be fully customisable, just like in the other indicator (ORT) Supply Demand button which I also attach. I would really appreciate if some coder can do this. Best regards and green pips {file} {file}
Alright, so quick update to the question I had posted earlier.
For anyone who'd taken an interest, it turns out that ArraySetAsSeries() is actually quite important for obtaining the correct values. MQL4 documentation is not quite clear on this and does not provide a replicable example when dealing with series/non-series arrays. In order to obtain the correct values, the RSI array has to be set as series before populating it with data. The correct code for the RSI/BB should therefore be:
So when you call the function, you now get the correct values.
Attached Image (click to enlarge)
I got this solution from the Orchard Forex YouTube channel which along with the JimDandy1958 channel I highly recommend especially for beginner and intermediate coders.
{quote} Trading is basically a psychology thing. Profitable trading has not much to do with applying a strategy or technique. I gather statistics to study patterns and devise in my own personal way methods that could help me fight fear and greed. Nothing to do with generation of signals or devising a profitable strategy. Trading will be conducted by a semi-automated EA. I am trying to devise an EA based on price action. by forward testing based on knowledge acquired by statistical indicators coded by Blue Rain and do visual backtesting by using...
Ignored
Hello simnz, thank you for taking a time and answering my post.
Every trader has to find own way and tools in a journey that mostly requires struggling with with own self all the time, rather than try to find a holy grail.
Hello all, I am trying to combine RSI and Bollinger Bands within an EA but I seem to be running into a weird problem. When I combine the default RSI with Bollinger Bands using Previous Indicator's Data or within an indicator (see attached) , I obtain the correct values. {file}However, when I copy the RSI values into a static array with 100 elements, I get totally different results for the Bollinger Bands. double rsi[100]; double rsi_bb_main[100]; double rsi_bb_upper[100]; double rsi_bb_lower[100]; //+------------------------------------------------------------------+...
Ignored
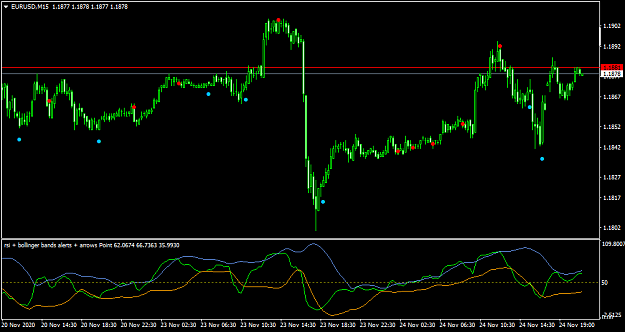
"rsi + bollinger bands alerts + arrows Point"
Dont know still you needs some well coded RSI BB,here is Mladen's and Mrtools tweaked toy
some usual 4 basic averaging methods for bb
20 prices for rsi
full alerting package
full arrowing package
line or dots for rsi option (bar to bar dots)
{quote} Dear BlueRain (and Lucky1359) Would it be complicated to put the label of the day of the week left to the date ? In any case thanks for that interesting indi. Best
Ignored
More space needed..
Anyway, I added option so it is just avail if needed.
input bool ShowTimeColume = false; //Show Timeformat for Candle Index input bool Prefix_Weekdays_to_Time = false;
if first is true, it will show time, if 2nd is also true, it will show Weekdays.
Hi Mntiwana, thank you for taking the time. I was actually looking for a way to implement RSI/BB in an EA using arrays. I finally found a solution which I detailed in Post #41,782. Regards.
nevermind, then i deleted my post because not usefull .. it's your rule
{image} {image} {image}
Ignored