• Home
  • Forums
  • Trades
  • News
  • Calendar
  • Market
  • Brokers
  • Login
  • Join
  • User/Email: Password:
  • 9:29pm
Menu
  • Forums
  • Trades
  • News
  • Calendar
  • Market
  • Brokers
  • Login
  • Join
  • 9:29pm
Sister Sites
  • Metals Mine
  • Energy EXCH
  • Crypto Craft

Options

Bookmark Thread

First Page First Unread Last Page Last Post

Print Thread

Similar Threads

TOP 100 best indicators: post good indicators here 583 replies

Lagging Indicators -vs- Leading Indicators 48 replies

Create MT5 indicators from MT4 indicators 3 replies

Custom Indicators vs. Technical Indicators 5 replies

  • Recycle Bin
  • /
  • Reply to Thread
  • Subscribe
  • 121
Attachments: (binned per thread starter’s request) Indicators for Discretionar
Exit Attachments

(binned per thread starter’s request) Indicators for Discretionar

  • Last Post
  •  
  • 1 23Page 456 12
  • 1 3Page 45 12
  •  
  • Post #61
  • Quote
  • Oct 29, 2020 7:13am Oct 29, 2020 7:13am
  •  robots4me
  • Joined Dec 2017 | Status: Member | 4,378 Posts
Quoting Waih
Disliked
Dear @robots4me (https://www.forexfactory.com/robots4me) , Appreciate your amazing works on this indies and your kindness for sharing the same. Got one request though, would you kindly be willing to share the mq4 files especially for Trix and RSI Exit indies so i can possibly port them over to MT5, or maybe you already have them on Mt5? Regards
Ignored
@Waih -- thanks for the good word. As for your question -- you'll find the answer in post #1.
1
 
  • Post #62
  • Quote
  • Oct 29, 2020 7:45am Oct 29, 2020 7:45am
  •  Waih
  • | Joined Aug 2018 | Status: Member | 48 Posts
Quoting robots4me
Disliked
{quote} @Waih -- thanks for the good word. As for your question -- you'll find the answer in post #1.
Ignored
Oooh i see, My bad n apologies. Many thanks again for your generous, awesome and super helpful indicators. It can only get better from here.

Thanks a bunch
In It To Win
 
1
  • Post #63
  • Quote
  • Oct 29, 2020 8:28am Oct 29, 2020 8:28am
  •  Bazzza
  • | Joined Sep 2014 | Status: Member | 191 Posts
Quoting robots4me
Disliked
{quote} @Bazzza -- I already have. At the top of the thread you'll see a paper clip followed by a number -- currently it is at '49'. Click on the paper click and it will take you to a new page with all the uploaded files and images associated with this thread.
Ignored

Thank you and thanks for your fast response
 
1
  • Post #64
  • Quote
  • Oct 29, 2020 9:37am Oct 29, 2020 9:37am
  •  Nonip
  • | Joined Nov 2019 | Status: Member | 130 Posts
Hi @robots4me, I have been lurking for quite a few days now. First of all, I would love to sincerely thank you for sharing all your indicators freely. I am a massive fun of ADRs and will be testing the TMA en fussed with the ADRs. That said, you mentioned that the R4M-LabTrend uses PA to generate signals...would you mind elaborating on which "PA" it uses. In the meantime...I will be testing it together with the R4M-MarneyRange-OnChart. TIA
"You can't buy the bottom, nor sell the top. The best you can strive for is
 
1
  • Post #65
  • Quote
  • Edited at 3:10pm Oct 29, 2020 11:40am | Edited at 3:10pm
  •  robots4me
  • Joined Dec 2017 | Status: Member | 4,378 Posts
Quoting Nonip
Disliked
Hi @robots4me, I have been lurking for quite a few days now. First of all, I would love to sincerely thank you for sharing all your indicators freely. I am a massive fun of ADRs and will be testing the TMA en fussed with the ADRs. That said, you mentioned that the R4M-LabTrend uses PA to generate signals...would you mind elaborating on which "PA" it uses. In the meantime...I will be testing it together with the R4M-MarneyRange-OnChart. TIA
Ignored
@Nonip -- thanks for the good word.

Indicators can be classified as one of two types -- Moving Average (MA) or Price Action (PA). The classification isn't that important and would rarely affect how we trade them -- in the end we trade them based on the type of markings they draw on a chart. I may write a short post in the next few days explaining more. An MA-type of indicator employs a moving average somewhere in its algorithm. The way you know it's a MA-type of indicator is there is usually a 'Period' or 'Length' setting exposed in the input dialog. A moving average is coded using algebra. A PA-type of indicator does not use a moving average. There is no 'Period' or 'Length' setting. Its algorithm often times revolves around comparing bars. Everything is a trade-off -- and that applies to forex, as well. I don't necessarily favor one type over another -- my charts usually include some kind of combination. One advantage of a PA-type of indicator is it doesn't require optimization, since there is no 'Period' or 'Length' setting to optimize. One advantage of an MA-type of indicator is that it can be used to draw trends. Hopefully that gives you a flavor of what I mean...

EDIT: Just to be clear #1 -- an MA-type of indicator doesn't necessarily include "moving average" in its name -- e.g. Bollinger Bands, RSI, CCI, TDI, Stochastics, etc. Also, the vast majority of indicators use moving average somewhere in their algorithm. As for PA-type of indicators, the few that I can think of off the top of my head include Fractals, Fibonacci, Pivots, ADR (ATR), LabTrend, Hi-Lo, PreviousDay, Supply-Demand, Support-Resistance, and so on.

EDIt: Just to be clear #2 -- when I say that a PA-type of indicator doesn't use algebra what I mean is that it doesn't call functions that compute moving averages. Rather, they primarily use basic math operations along with comparisons.
1
5
  • Post #66
  • Quote
  • Oct 30, 2020 6:30am Oct 30, 2020 6:30am
  •  Nonip
  • | Joined Nov 2019 | Status: Member | 130 Posts
Quoting robots4me
Disliked
{quote} @Nonip -- thanks for the good word. Indicators can be classified as one of two types -- Moving Average (MA) or Price Action (PA). The classification isn't that important and would rarely affect how we trade them -- in the end we trade them based on the type of markings they draw on a chart. I may write a short post in the next few days explaining more. An MA-type of indicator employs a moving average somewhere in its algorithm. The way you know it's a MA-type of indicator is there is usually a 'Period' or 'Length' setting exposed in the...
Ignored
Thanks for the insight
"You can't buy the bottom, nor sell the top. The best you can strive for is
 
1
  • Post #67
  • Quote
  • Oct 30, 2020 6:34am Oct 30, 2020 6:34am
  •  robots4me
  • Joined Dec 2017 | Status: Member | 4,378 Posts
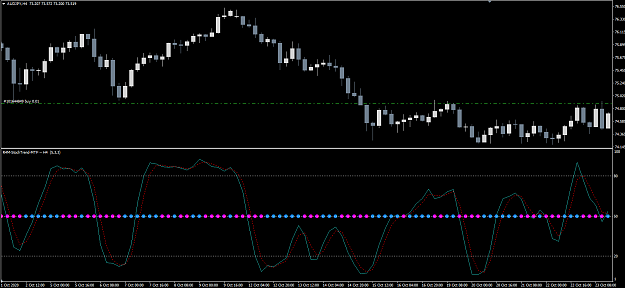
R4M-StochTrend-MTF

The screenshot below is the R4M-StochTrend-MTF indicator. As you can see, it is based on the Stochastics indicator -- plus some dots.

Attached Image (click to enlarge)
Click to Enlarge

Name: StochTrend.png
Size: 29 KB


So, what are the dots? Stochastics is typically charted using two lines -- the light blue is referred to as "main" and the dashed red as "signal". When "main" is above "signal" then the trend is bullish and the dots are blue. When the "main" is below "signal" then the trend is bearish.

There is more than one way to use this indicator when trading. For example:
(1) treat crossings as signals -- e.g. when "main" crosses 80/20 or when "main" crosses "signal".
(2) treat "main" above / below "signal" as trend confirmation

Personally, I prefer to use this for trend confirmation -- and that is where the dots come in. When "main" is above "signal" then the dots are blue, and when "main" is below "signal" then the dots are purplse. You could also treat the transition from blue-to-purple dots or purple-to-blue dots as a BUY or SELL signal (respectively), but I prefer to use Stochastics strictly for confirmation purposes and not for signals.


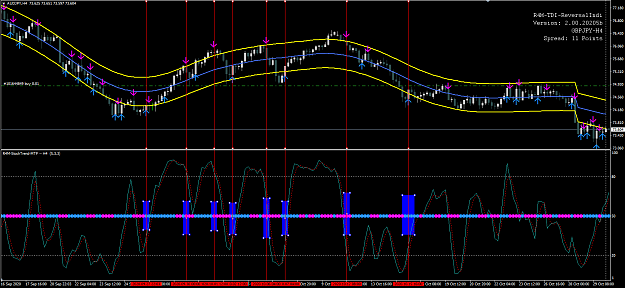
In the next screenshot I've added the R4M-MarneyRange-OnChart and centered TMA indicators as an example of a reversal trading strategy -- when the price sticks its nose above / below an ADR band then trade-away.

Attached Image (click to enlarge)
Click to Enlarge

Name: StochTrend-plus-Marney.png
Size: 54 KB


The vertical red lines start at a Marney arrow where an extreme price is above / below an ADR band, and then extend below to the StochTrend indicator. With the blue rectangles I've attempted to highlight how the R4M-StochTrend-MTF indicator provides nice confirmation. The vertical red lines pass through a blue / purple dot that is aligned in the same direction as the Marney arrow.


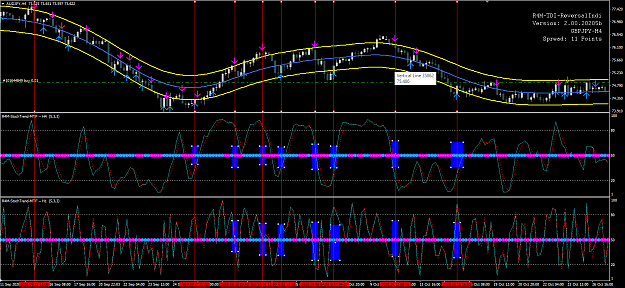
And, finally, the R4M-StochTrend-MTF is coded as a multi-timeframe indicator -- that is, more than one timeframe can be displayed on the same chart. In the screenshot below you can see the indicator displayed using both H4 and H1 data. The vertical red lines are the same as the above image. And as you can see when the Marney arrow plus H4 dot plus H1 dot align in the same direction then that would be a high-probability trade.

Attached Image (click to enlarge)
Click to Enlarge

Name: StochTrend-MTF-plus-Marney.png
Size: 73 KB


One last note -- a reminder -- when trading H4 you don't need long runners. You only need to be on the correct side of price direction to win 50-60 Pips. So most of my trades don't last longer than 2 H4 bars before I exit. And since I trade 28 pairs, then Pips can add up quickly.


Attached File
File Type: ex4 R4M-StochTrend-MTF.ex4   60 KB | 308 downloads
1
4
  • Post #68
  • Quote
  • Nov 1, 2020 12:17pm Nov 1, 2020 12:17pm
  •  iamsovereign
  • Joined Jul 2013 | Status: Member | 859 Posts
Hay R4M, good to see you still in the game. As always you run a good thread, some of the best stuff around

Thanks for your time and contributions.

Regards
Live today like theres no tomorrow-- Prioritize like you will die today
1
1
  • Post #69
  • Quote
  • Nov 1, 2020 2:13pm Nov 1, 2020 2:13pm
  •  Peppaer
  • Joined Oct 2020 | Status: Member | 14 Posts
Hi R4M,

Thanks for the indicators. I love Mladen's work and starting to love yours too. Learned a lot from this Thread since you explained them in a simple way.

Stay blessed!

Regards,
Peppaer
Kiwi, why you so weak?????????
 
1
  • Post #70
  • Quote
  • Nov 1, 2020 10:48pm Nov 1, 2020 10:48pm
  •  lotv
  • | Joined Dec 2004 | Status: Member | 74 Posts
A pity they are not displayed in mg4 format ...I am trading similar indicators and I have to admit that there are some real genius's out there. it is difficult to lose if used properly.....
 
1
  • Post #71
  • Quote
  • Nov 2, 2020 3:53am Nov 2, 2020 3:53am
  •  Simontw
  • Joined Jun 2017 | Status: Member | 377 Posts
Thanks for sharing these.......I still use some of the indis from the previous thread...especially the dashboards.
Many thanks.
EX BBMA trader focusing on REE code.
 
1
  • Post #72
  • Quote
  • Edited Nov 3, 2020 10:38am Nov 2, 2020 10:41pm | Edited Nov 3, 2020 10:38am
  •  robots4me
  • Joined Dec 2017 | Status: Member | 4,378 Posts
"Signal Generators" Versus Trend-Confirming Filters

What I'm about to comment on in this post is nothing new -- most of us probably treat indicators the same way though we may not be aware of it. My intent is to explicitly state the two ways indicators are most commonly used because when you think about them and treat them as either "signal generators" or trend-confirming filters then they become easier to use and mix and match. And that results in successful trading results.

Signal Generators
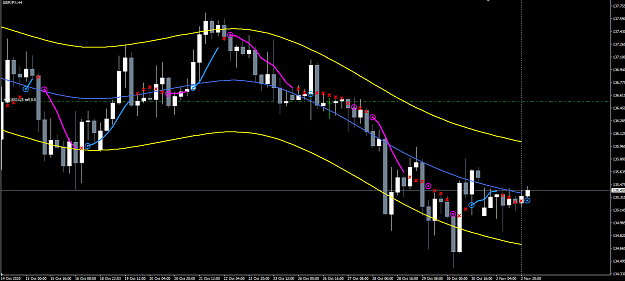
The R4M-BBIITX indicator that I shared earlier in this thread is a "signal generator". It's algorithm computes candidate signals. I use the word "candidate" on purpose. You don't necessarily trade a candidate signal. A candidate signal is a wake-up call that it is time to use your brain to make some discretionary decisions. In the screen shot below the blue and purple circles are candidate signals generated by the BBIITX algorithm. In many cases they are good enough on their own to represent high-probability trades. But you can do even better...

Attached Image (click to enlarge)
Click to Enlarge

Name: BBIITX-Signal-Generator.png
Size: 37 KB


Trend-Confirming Filters
An indicator used as a trend-confirming filter does not generate candidate signals -- well, that's not exactly true. It probably does but we don't interpret its markings as BUY or SELL signals. Rather, a filter indicator is used in combination with a signal generator indicator. When a candidate signal aligns with filter indicator then you likely have a very high-probability trading opportunity. In the screenshot below the purple and blue dots represent bearish and bullish trends, respectively.

Attached Image (click to enlarge)
Click to Enlarge

Name: StochTrend-Filter.png
Size: 28 KB


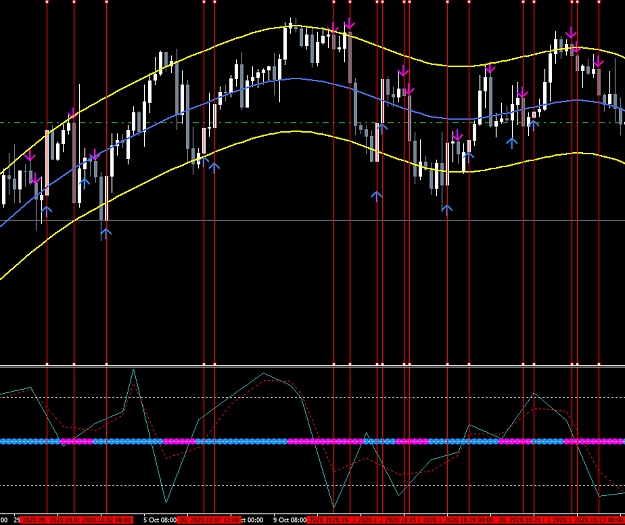
And the screenshot below is an example of how I might align candidate signals with a trend-confirming filter to select for the highest-probability trades. The vertical red lines pass through candicate signals that align with the filter. You can see that about 25% of the candidate signals do not align. As a discretionary trader it is now up to you whether or not to trade those. I'm intentionally omitting details of which indicators are used in the example -- I just wanted to show how the two types of indicators can be used.

Attached Image (click to enlarge)
Click to Enlarge

Name: Signal-plus-filter.png
Size: 39 KB


I like combining indicators because often times patterns or clues jump out that you wouldn't otherwise notice. And when looking at a chart if you can break down which indicators are providing candidate signals and which are providing trend confirmation then it removes some of the guess work. Also, when you describe your strategy it really helps the other person understand it when you are clear about which indicator(s) provides the candidate signal and which provide trend confirmation.

As I comment in future posts I'll often use "signal" or "trend-confirming filter" when describing an indicator.
1
6
  • Post #73
  • Quote
  • Edited at 10:40am Nov 3, 2020 1:37am | Edited at 10:40am
  •  robots4me
  • Joined Dec 2017 | Status: Member | 4,378 Posts
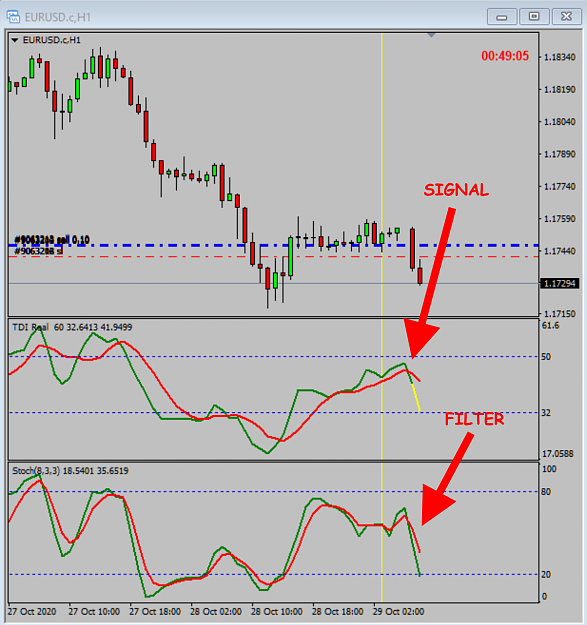
Another good example where a signal generator and trend-confirming indicators are combined in a trading strategy is Trading Made Simple (TMS) -- https://www.forexfactory.com/thread/291622-trading-made-simple. In the TMS strategy when TDI's green line crosses the red line then that is considered a candidate signal. That is your wake-up call. The discretionary trader then looks for other clues -- e.g. Stochastics. That is, Stochastics is used for trend direction confirmation -- it is used to filter candidate signals.

Let me see if I can find an example from the TMS thread -- though that may be hard because @Tekkies and @emmanuel7788 don't post many screenshots (that is sarcasm, for those unfamiliar with the TMS thread). Oh, wait, here's one -- TDI crossing is the signal, and Stochastics is the filter (providing trend direction confirmation).

Attached Image (click to enlarge)
Click to Enlarge

Name: TDI-Signal-plus-Filter.png
Size: 191 KB
1
 
  • Post #74
  • Quote
  • Nov 3, 2020 2:19am Nov 3, 2020 2:19am
  •  robots4me
  • Joined Dec 2017 | Status: Member | 4,378 Posts
R4M-ZWinner

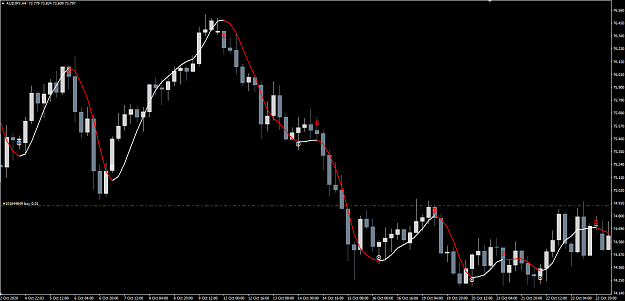
A new favorite of mine is the R4M-ZWinner indicator. It is derived from the ZWinnerColorSignals indicator that I stumbled across on @hasib's "Z Winner Strategy" thread (https://www.forexfactory.com/thread/1035753-z-winner-strategy). My modification adds the red and white circles that mark the transition between the red and white lines. The red and white circles represent candidate signals -- as I discussed in the previous two posts.

Attached Image (click to enlarge)
Click to Enlarge

Name: ZWinner.png
Size: 28 KB

This indicator really does generate extremely nice signals. I wouldn't have noticed it but for @ryuryu's rude post where he mocked @hasib for using repainting indicators in his strategy. Because of my past experience with @ryuryu and his BS I then decided to check for myself. It took 2 minutes -- maybe less -- to confirm this indicator does NOT repaint. It does recalculate Bar[0], as do most indicators, but it generates excellent, non-repainting signals. If you still don't understand the difference between repainting and recalculating Bar[0] then read post #3 (https://www.forexfactory.com/thread/post/13219524#post13219524). In the end the fact that @ryuryu still doesn't understand worked out well for me -- I've now incorporated this indicator into one of my EAs. Thank you @hasib and @ryuryu!!

Attached File
File Type: ex4 R4M-ZWinner.ex4   57 KB | 363 downloads
1
5
  • Post #75
  • Quote
  • Nov 3, 2020 3:00am Nov 3, 2020 3:00am
  •  xxsskxx
  • | Joined Aug 2019 | Status: Member | 101 Posts
Quoting robots4me
Disliked
R4M-ZWinner A new favorite of mine is the R4M-ZWinner indicator. It is derived from the ZWinnerColorSignals indicator that I stumbled across on @hasib's "Z Winner Strategy" thread (https://www.forexfactory.com/thread/1035753-z-winner-strategy). My modification adds the red and white circles that mark the transition between the red and white lines. The red and white circles represent candidate signals -- as I discussed in the previous two posts. {image} This indicator really does generate extremely nice signals. I wouldn't have noticed...
Ignored
Thank you for this indicator, i was also monitoring that thread and was intrigued

Im trialling a daily system for which I'm hoping this is useful, when I try to use this on a daily chart, it does not allow me to, is this intended?

Thank you again!
 
1
  • Post #76
  • Quote
  • Nov 3, 2020 3:12am Nov 3, 2020 3:12am
  •  robots4me
  • Joined Dec 2017 | Status: Member | 4,378 Posts
Quoting xxsskxx
Disliked
{quote} Thank you for this indicator, i was also monitoring that thread and was intrigued Im trialling a daily system for which I'm hoping this is useful, when I try to use this on a daily chart, it does not allow me to, is this intended? Thank you again!
Ignored
@xxsskxx -- that restriction is a reminder to me, since I only trade H4 (and below). Here is an updated version of the indicator with that restriction removed.

Attached File
File Type: ex4 R4M-ZWinner.ex4   39 KB | 421 downloads
1
6
  • Post #77
  • Quote
  • Nov 3, 2020 3:25am Nov 3, 2020 3:25am
  •  robots4me
  • Joined Dec 2017 | Status: Member | 4,378 Posts
Quoting lotv
Disliked
A pity they are not displayed in mg4 format ...I am trading similar indicators and I have to admit that there are some real genius's out there. it is difficult to lose if used properly.....
Ignored
@lotv -- thanks for the good word, I think. It's a "pity" for whom? Isn't it enough that I shared the indicator?
1
1
  • Post #78
  • Quote
  • Nov 3, 2020 4:26am Nov 3, 2020 4:26am
  •  xxsskxx
  • | Joined Aug 2019 | Status: Member | 101 Posts
Quoting robots4me
Disliked
{quote} @xxsskxx -- that restriction is a reminder to me, since I only trade H4 (and below). Here is an updated version of the indicator with that restriction removed. {file}
Ignored
Thanks

Sorry to be a pain, but I use a light background, any change we could have the ability to amend the indicator colours? Ill adjust if not, thanks
 
 
  • Post #79
  • Quote
  • Nov 3, 2020 4:31am Nov 3, 2020 4:31am
  •  derekw
  • Joined Mar 2013 | Status: Member | 1,579 Posts
Nice thread R4M. I have been a long time fan on Mladens TMA.
 
1
  • Post #80
  • Quote
  • Nov 3, 2020 6:32am Nov 3, 2020 6:32am
  •  Bazzza
  • | Joined Sep 2014 | Status: Member | 191 Posts
Hi robots4me, I like your thread and indicators a lot. I have the same problem as xxsskxx in as much as I use a white background so cannot see some indicators properly. Could you please post the files so we could at least change that. Thank you and keep up the great work.

Baz
 
 
  • Recycle Bin
  • /
  • (binned per thread starter’s request) Indicators for Discretionar
  • Reply to Thread
    • 1 23Page 456 12
    • 1 3Page 45 12
0 traders viewing now
  • More
Top of Page
  • Facebook
  • Twitter
About FF
  • Mission
  • Products
  • User Guide
  • Media Kit
  • Blog
  • Contact
FF Products
  • Forums
  • Trades
  • Calendar
  • News
  • Market
  • Brokers
  • Trade Explorer
FF Website
  • Homepage
  • Search
  • Members
  • Report a Bug
Follow FF
  • Facebook
  • Twitter

FF Sister Sites:

  • Metals Mine
  • Energy EXCH
  • Crypto Craft

Forex Factory® is a brand of Fair Economy, Inc.

Terms of Service / ©2022