• Home
  • Forums
  • Trades
  • News
  • Calendar
  • Market
  • Brokers
  • Login
  • Join
  • User/Email: Password:
  • 6:10pm
Menu
  • Forums
  • Trades
  • News
  • Calendar
  • Market
  • Brokers
  • Login
  • Join
  • 6:10pm
Sister Sites
  • Metals Mine
  • Energy EXCH
  • Crypto Craft

Options

Bookmark Thread

First Page First Unread Last Page Last Post

Printable Version

Similar Threads

Fixing Your Indicators or EAs (Free) 451 replies

Coding robots and indicators in C# for no charge (cTrader API) 180 replies

Oanda MT4 - Indicators and EAs not showing 1 reply

EAs and indicators relating to moutaki... 22 replies

InterbankFX has loaded its MT4 platform with custom EAs, indicators and scripts 1 reply

  • Platform Tech
  • /
  • Reply to Thread
  • Subscribe
  • 29,697
Attachments: I will code your EAs and Indicators for no charge
Exit Attachments

I will code your EAs and Indicators for no charge

  • Last Post
  •  
  • 1 20262027Page 202820292030 2172
  • 1 Page 2028 2172
  •  
  • Post #40,541
  • Quote
  • Oct 22, 2020 1:11pm Oct 22, 2020 1:11pm
  •  BlueRain
  • Joined Sep 2019 | Status: Member | 826 Posts
Quoting lucky1359
Disliked
Dear Blues Rain. How are you? Hope you are fine and in high spirits. Many FF users are using the Marvelous Indicator that you have created in many different ways. I have a request for a new Indicator. Picture will help to understand better {image} Three Basic Requirements 1. Pip Difference Across Pairs and Total sum at the end. 1st column only current difference as shown in the picture + or - 2nd colum only the max reached in that time frame + or – For example we apply the indi on EURUSD – 1 Day Time Frame the 1st column Will show current pips Plus...
Ignored
1st column only current difference as shown in the picture + or - -> so, this is close - open ?
2nd column only the max reached in that time frame + or – -> so, this is high - open ?
I still don't know where is the Holy Grail
  • Post #40,542
  • Quote
  • Oct 22, 2020 2:04pm Oct 22, 2020 2:04pm
  •  Hakata
  • | Joined Oct 2020 | Status: Junior Member | 2 Posts
Quoting mntiwana
Disliked
{quote} "DailyLinesBoxes" Welcome to FF community - Dont know which level you talking about and or required any way posting daily boxes indicator (that includes H lines too),a kind of daily level that can be extended up to users defined limits (decreased/increased) boxes also can be defined how many days back and show or hide start/end hours,when to start drawing and when and where to end by defined hours {image}{image}{image} {file}
Ignored
thanks for your reply. Unfortunately, I have incorrectly described the task. the fact is that I calculate the levels using the Quikstrike service and MS Excel. I save the results in a text file and manually draw the lines.
  • Post #40,543
  • Quote
  • Oct 22, 2020 2:57pm Oct 22, 2020 2:57pm
  •  RamnathanKB
  • | Joined Oct 2020 | Status: Member | 7 Posts
Quoting mntiwana
Disliked
{quote} {quote} {quote} Guys Beware of fractal repainting behavior,at least use some filter/s to avoid cleaning your account/s
Ignored
Thank you. It is a single candle sculping on one hour timeframe and i have been doing it manually for sometime.!!
  • Post #40,544
  • Quote
  • Oct 22, 2020 4:12pm Oct 22, 2020 4:12pm
  •  tomx
  • | Joined Nov 2013 | Status: Member | 42 Posts
Quoting Idonotgiveup
Disliked
Can anyone put an alarm on this indicator when the arrows appear - For MT5? Thank you {file}
Ignored
Attached File
File Type: mq5 Reverse_No_Repair(Alert).mq5   7 KB | 44 downloads
  • Post #40,545
  • Quote
  • Edited at 5:12pm Oct 22, 2020 4:51pm | Edited at 5:12pm
  •  BlueRain
  • Joined Sep 2019 | Status: Member | 826 Posts
Quoting lucky1359
Disliked
Dear Blues Rain. How are you? Hope you are fine and in high spirits. Many FF users are using the Marvelous Indicator that you have created in many different ways. I have a request for a new Indicator. Picture will help to understand better {image} Three Basic Requirements 1. Pip Difference Across Pairs and Total sum at the end. 1st column only current difference as shown in the picture + or - 2nd colum only the max reached in that time frame + or – For example we apply the indi on EURUSD – 1 Day Time Frame the 1st column Will show current pips Plus...
Ignored
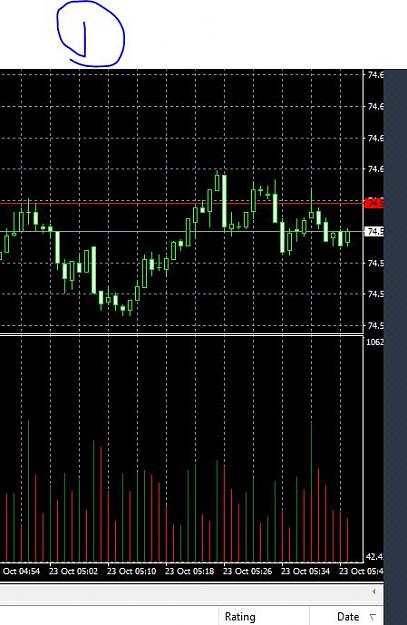
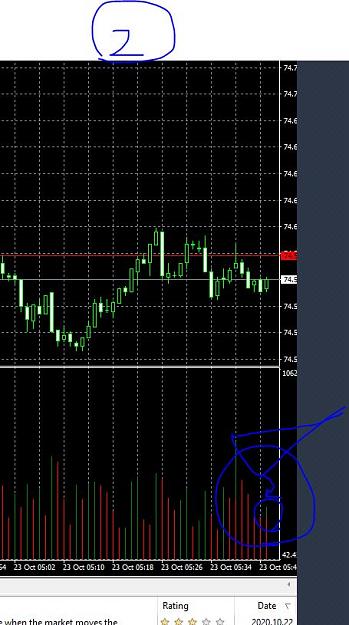
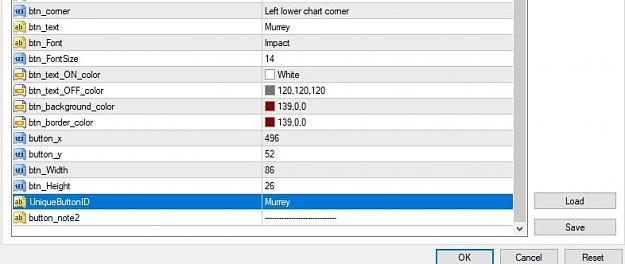
here, you have it
1. own unique ID
2. TimeFrame
3. X,Y poisiton

it will pull base name - and list all pair with base cur in symbol name
first col: current bar pip changed ( close - open )
2nd col: current bar pip changed ( high - open )

Attached Image
Attached Image
Attached File
File Type: mq4 BR Currency Basket OCHC DashBoard.mq4   35 KB | 80 downloads
I still don't know where is the Holy Grail
1
  • Post #40,546
  • Quote
  • Oct 22, 2020 4:53pm Oct 22, 2020 4:53pm
  •  talisean
  • | Joined Aug 2013 | Status: Member | 23 Posts
Quoting BlueRain
Disliked
{quote} Standard Way: ( At least this is how TMA draws colored MA center line ) 1. Have 3 Buffers for color - one for Uptrend, one for DownTrend, one for sideway 2. Have 1 Buffer for MA value 2. Define your TrendThreshold value ( in TMA ATR, it uses 0.01 ) 3. Now, get slope of MA depending on your period, you can compare value from previous MA to current MA ( 1 - PrevMA/CurMA ) 4. Fill the buffer based on slop value ( if more than your trend threshold, fill green, less- fill red, otherwise, fill sideway buffer )
Ignored
thankyou! an excellent answer which i will use. :-)
  • Post #40,547
  • Quote
  • Oct 22, 2020 6:20pm Oct 22, 2020 6:20pm
  •  Slingshots1
  • Joined Feb 2012 | Status: Member | 721 Posts
Quoting jeanlouie
Disliked
{quote} It deletes all objects, now it only deletes it's own. {file}
Ignored
Thanks jeanlouie please how about the alert input when prices close below or above the entry lines ?Thanks
  • Post #40,548
  • Quote
  • Oct 22, 2020 6:29pm Oct 22, 2020 6:29pm
  •  solorik
  • | Joined Mar 2011 | Status: Member | 58 Posts
Quoting BlueRain
Disliked
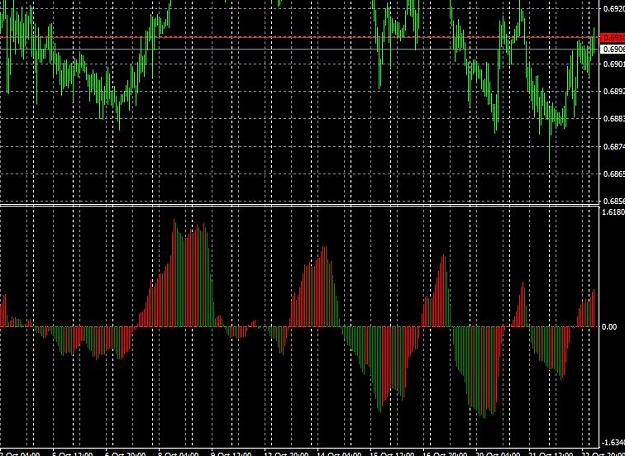
{quote} ( FAST MovingAverage - Slow MovingAverage ) is practically MACD. you are asking line value of MACD/ATR macd = iMA(NULL,0,FastEMA,0,MODE_EMA,PRICE_CLOSE,i) - iMA(NULL,0,SlowEMA,0,MODE_EMA,PRICE_CLOSE,i); atr = iATR(Symbol(),0,ATRPeriod,i); Buffer[i] = macd/atr; Just two lines needed for this. You can change MAs period and ATR period in options. {image} {file}
Ignored
thanks bluerain you're the best
can you please make it like bars instead of line
with the ability to color the higher bars and the lower bars
thanks alot
  • Post #40,549
  • Quote
  • Oct 22, 2020 7:18pm Oct 22, 2020 7:18pm
  •  Peluq
  • | Joined Jun 2013 | Status: Member | 60 Posts
Good night someone can fix this script. I put it in mt4, I restart the mt4, I put it back and the offline chart is different. Thanks

Attached File
File Type: mq4 Create_Basket_Script_02.mq4   15 KB | 35 downloads
  • Post #40,550
  • Quote
  • Oct 22, 2020 8:28pm Oct 22, 2020 8:28pm
  •  solorik
  • | Joined Mar 2011 | Status: Member | 58 Posts
Quoting solorik
Disliked
{quote} thanks bluerain you're the best can you please make it like bars instead of line with the ability to color the higher bars and the lower bars thanks alot
Ignored
i mean to be able to color the indicator like this
Attached Image (click to enlarge)
Click to Enlarge

Name: dacc471db447d54b11fccdd06ad5b031.png
Size: 2 KB
  • Post #40,551
  • Quote
  • Edited at 8:50pm Oct 22, 2020 8:28pm | Edited at 8:50pm
  •  BlueRain
  • Joined Sep 2019 | Status: Member | 826 Posts
Attached Image (click to enlarge)
Click to Enlarge

Name: solorik MACD ATR histogram.JPG
Size: 121 KB

Quoting solorik
Disliked
{quote} thanks bluerain you're the best can you please make it like bars instead of line with the ability to color the higher bars and the lower bars thanks alot
Ignored
Little change to histogram now.
Attached File
File Type: mq4 Solorik MACD ATR histogram.mq4   5 KB | 59 downloads
I still don't know where is the Holy Grail
  • Post #40,552
  • Quote
  • Oct 22, 2020 9:28pm Oct 22, 2020 9:28pm
  •  JukeMasterIV
  • | Joined Jun 2020 | Status: Member | 9 Posts
Hey Everybody! I’ve recently started dabbling with Renko charts and have been using a simple renko strategy with good profits. However, this strategy would do a lot better if an EA was made as more trade frequency = better monthly gain. The strategy is as follows:

Chart setup is 10 pip renko box + 50 ema

Buy Condition- Red candle changed to 2 consistent Green candle and current price is above 50 EMA. SL is at the low of the Red Candle (not the wick but the body)

Sell Condition is vice versa.

So basically you enter on the start of the 3rd green candle for a buy and vice versa for a sell.

This seems simple enough to be converted to an EA but sadly I don’t have any experience in coding. Any help would be amazing!
  • Post #40,553
  • Quote
  • Edited at 10:21pm Oct 22, 2020 10:11pm | Edited at 10:21pm
  •  simnz
  • Joined Nov 2015 | Status: Member | 1,306 Posts
Hi Blue Rain,

You really have a way with indicators for statistical analysis. Thank you for sharing them.

May I request you to code for me an indicator which can count bar pattern occurrences in a particular period ( measured by Pips), create full database for analysis in excel file, print 30 rows of table on the chart and print lines on the chart for visualisation , and print statistics by way of comments on the chart for the following price actions


Open to high,
Open to low
Open to close

High to Open,
High to Low,
High to Close

Low to open,
Low to High
Low to close

Close to open
Close to high
Close to Low

Data period
For looking back and back testing

Chart TF current
Period: Start yy-mm-dd hh mm
Number of bars to look back

For forward testing
Use Daily HH MM

Usage example

I want to find out how many times Close to Low or any of 12 bars sequence occurred and generated pips counted , sorted and clubbed together in five groups of say Less than 4 pips , 5-8 pips, 9-13, , 14-20 and More than 21 pips.

Thank you
Learning to Do to Earn
  • Post #40,554
  • Quote
  • Oct 22, 2020 10:30pm Oct 22, 2020 10:30pm
  •  bdunn
  • | Joined Apr 2012 | Status: Member | 92 Posts
Quoting BlueRain
Disliked
{quote} Here is demo version that should work for you as sample. Please use as reference and you can fix yours. You can modify where you calculate MA to get typical_price. I just used period of 1 to get typical price MA. Or you can calcurate yourself like Typical price = (high + low + close)/3 basically, you have to have two buffers - one for red and one for green. now, check vol * typical price for privious bar and current bar. if current bar is bigger -> store in Buffer 1 ( green ) if current bar is smaller -> store in Buffer 2 ( red ) that is...
Ignored
Hi BlueRain:

I found out if I left the indicator on the chart without switching to other TFs or other symbols, the indicator will NOT update nor plot the latest value accordingly as the new bars are formed. Pls kindly take a look, plot it on your chart and you will get what I meant.

Your Codes as Previously Posted:
Attached File
File Type: mq4 Volume x Typical Price BR demo.mq4   5 KB | 33 downloads
Screenshot as An Example: https://ibb.co/TbWpKFK

BlueRain, pls kindly help me out on this bug so that the indicator will update & plot continuously.

My Humble Request,
Bill
  • Post #40,555
  • Quote
  • Oct 22, 2020 10:45pm Oct 22, 2020 10:45pm
  •  BlueRain
  • Joined Sep 2019 | Status: Member | 826 Posts
Quoting bdunn
Disliked
{quote} Hi BlueRain: I found out if I left the indicator on the chart without switching to other TFs or other symbols, the indicator will NOT update nor plot the latest value accordingly as the new bars are formed. Pls kindly take a look, plot it on your chart and you will get what I meant. Your Codes as Previously Posted: {file}Screenshot as An Example: https://ibb.co/TbWpKFK BlueRain, pls kindly help me out on this bug so that the indicator...
Ignored
Are you talking about demo version?
I just dropped to M1 chart - and it works fine with me.

Attached Image (click to enlarge)
Click to Enlarge

Name: demo1.JPG
Size: 67 KB
Attached Image (click to enlarge)
Click to Enlarge

Name: demo2.JPG
Size: 75 KB
Attached Image
I still don't know where is the Holy Grail
  • Post #40,556
  • Quote
  • Oct 22, 2020 11:04pm Oct 22, 2020 11:04pm
  •  junel1988
  • | Joined Oct 2020 | Status: Member | 7 Posts
Quoting junel1988
Disliked
{quote} Thank you very much @BlueRain for your effort, I really appreciate that you took the time to code this. I looked at the code and there's no way for me to understand how it works. I tried it today on 21pairs. Unfortunately, there was no alert/notification generated even though several pairs crossed the horizontal lines. If you have the time, can you please take a look at it. Can you please also set it to alert/notify on real-time, but limit to 1alert/hr. I'm not sure if you have already added this option. I found a similar indicator...
Ignored
Hello @BlueRain. If you have the time, can you please take a look at this? Thank you.
  • Post #40,557
  • Quote
  • Oct 22, 2020 11:05pm Oct 22, 2020 11:05pm
  •  simnz
  • Joined Nov 2015 | Status: Member | 1,306 Posts
Quoting BlueRain
Disliked
{quote} Standard Way: ( At least this is how TMA draws colored MA center line ) 1. Have 3 Buffers for color - one for Uptrend, one for DownTrend, one for sideway 2. Have 1 Buffer for MA value 2. Define your TrendThreshold value ( in TMA ATR, it uses 0.01 ) 3. Now, get slope of MA depending on your period, you can compare value from previous MA to current MA ( 1 - PrevMA/CurMA ) 4. Fill the buffer based on slop value ( if more than your trend threshold, fill green, less- fill red, otherwise, fill sideway buffer )
Ignored
Do you have any tips for a non-coder designing entries and exits for auto trading ?
Nothing in specific. In general some kind of bulleted checklist will do.

By the way how many buffers (min and maximum) can be used for MT4?

Are you proficient in MT4 or in MT5 as well?

Thank you.
Learning to Do to Earn
  • Post #40,558
  • Quote
  • Oct 22, 2020 11:07pm Oct 22, 2020 11:07pm
  •  simnz
  • Joined Nov 2015 | Status: Member | 1,306 Posts
Quoting BlueRain
Disliked
{quote} here, you have - momentum dashboard for all pair - with arrow signal to show if it is above or below for quick check. {image} {file}
Ignored
Just brilliant.
Learning to Do to Earn
  • Post #40,559
  • Quote
  • Edited Oct 23, 2020 12:06am Oct 22, 2020 11:33pm | Edited Oct 23, 2020 12:06am
  •  TrendLover
  • | Joined Jun 2019 | Status: Member | 149 Posts
Quoting TrendLover
Disliked
Hello guys, This indicator changes the timeframe by clicking the U and D keys. I would like to replace the U and D keys with Up and Down. How to do this? {image} {file}
Ignored
I learned how to do it.

Inserted Code
   switch(id)
     {
      case CHARTEVENT_KEYDOWN:
//         if(StringGetChar(Up_Key_Value,0)==lparam)
         if(38==lparam)
           {
            if(i<9)
              {
               ChartSetSymbolPeriod(0,NULL,enum_timeframes[++i]);
              }
           };
//         if(StringGetChar(Down_Key_Value,0)==lparam)
         if(40==lparam)
           {
            if(i>1)
              {
               ChartSetSymbolPeriod(0,NULL,enum_timeframes[--i]);
              }
           };
     }
Attached File
File Type: mq4 ChangeTimeframe.mq4   6 KB | 27 downloads
  • Post #40,560
  • Quote
  • Oct 22, 2020 11:54pm Oct 22, 2020 11:54pm
  •  koka.azzar
  • | Joined Oct 2019 | Status: Member | 9 Posts
Quoting koka.azzar
Disliked
I need your help to code EA, that can: - Place pending orders and take profit right after entering the order. - Pending orders are 10pip apart (can modify pip for demand). - Can choose the number of pending orders according to your needs. - The SL of pending orders changes corresponding to 10pip (can modify) from previous order. - When reaching 20pip (can modify) move BE. Thank you so much !
Ignored
Anybody can help me????

Thanks

Koka
  • Platform Tech
  • /
  • I will code your EAs and Indicators for no charge
  • Reply to Thread
    • 1 20262027Page 202820292030 2172
    • 1 Page 2028 2172
16 traders viewing now, 7 are members:
eddie777
,
Invisible
,
ffss
,
Invisible
,
Invisible
,
Ceto
,
Kage007
  • More
Top of Page
  • Facebook
  • Twitter
About FF
  • Mission
  • Products
  • User Guide
  • Media Kit
  • Blog
  • Contact
FF Products
  • Forums
  • Trades
  • Calendar
  • News
  • Market
  • Brokers
  • Trade Explorer
FF Website
  • Homepage
  • Search
  • Members
  • Report a Bug
Follow FF
  • Facebook
  • Twitter

FF Sister Sites:

  • Metals Mine
  • Energy EXCH
  • Crypto Craft

Forex Factory® is a brand of Fair Economy, Inc.

Terms of Service / ©2021