Hello everyone.
Hope your trading is going fine.
I am posting here a script that I would have loved to pick on the net beforehand and that maybe already exists somewhere else.
This script can :
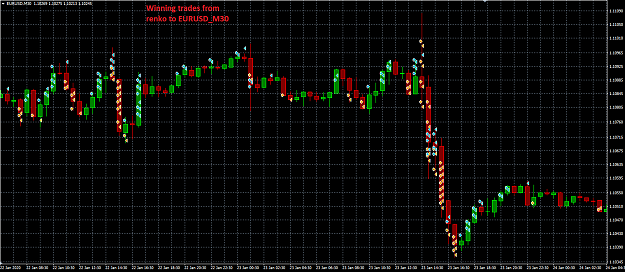
- Save to a csv file all the trade arrows existing in the selected chart which can be either a regular timeframed chart or a Renko chart.
- Load saved arrows from a specific csv file (with the considered internal structure).
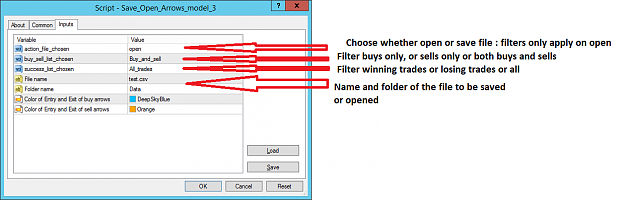
For loading arrows from file, there are 2 filters :
- loads only winning trades or only losing trades or both
- loads only buys or only sells or all.
- It also automatically filters the "symbol" according to the one of the chart.
As mentioned in the description, I have to inform you of :
Warning 1 : This script only handles objects and csv files with the correct structure. It is by no mean an indicator nor an EA. It won't open or close trades for you.
By using it, you recognise I decline all responsibilities in the use you may do with it.
Warning 2 : suits for real timeframe chart. May be inaccurate for Renkos, particularly in case of more bricks in only 1 minute. May also create inaccuracies if you have lost part of the history of your broker data and want to use metatrader server data which may be slightly different. I have not debugged it about the order of the arrows. For example, if you have one trade that opens on 8th of january at 12:00 and closes at 19:00 and another one that opens at 13:00 (or even 11:00) and closes at 20:00 (or even 18:00). It may cross your trades. I have not dedicated time to this specific aspect. The only way to tackle this should be to select your Results in backtest or Account History in live, right click on it, chose save as report, copy all the trades, remove comments and activity with your balance (withdrawal or transfer), and reorganise all the columns as they are in the csv file produced when you save it through the script. I know it is a little sporty but I have not worked yet on it. I only use a macro to do all of these rearrangements in the report.
If you are developing your own strategy or improving/adapting an existing one, it can be of great use to highlight the types you want. It should help to work better with indicators to define easily where your trades are more likely to win or to lose.
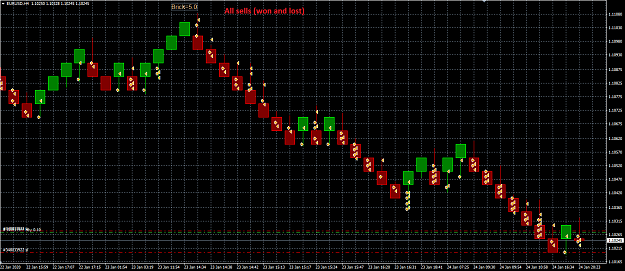
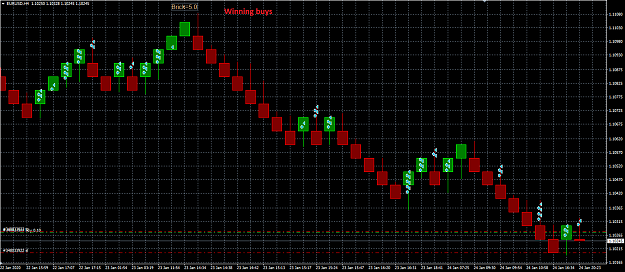
For example, you can save trade arrows from a timeframed chart and load them on a Renko chart or the opposite. You can as well save them from a 5 pips Renko chart and load it on a 2.5 pips Renko chart... Open four charts to display all and on one load winning buys, below, losing buys and on the right hand side winning sells above and losing sells below. Be free to use it with no boundaries of imagination.
Please note that it works in whatever chart that contains arrows. These arrows may be made by the simulator or in real time thanks to a real account or a demo account.
Sincerely
Hope your trading is going fine.
I am posting here a script that I would have loved to pick on the net beforehand and that maybe already exists somewhere else.
This script can :
- Save to a csv file all the trade arrows existing in the selected chart which can be either a regular timeframed chart or a Renko chart.
- Load saved arrows from a specific csv file (with the considered internal structure).
For loading arrows from file, there are 2 filters :
- loads only winning trades or only losing trades or both
- loads only buys or only sells or all.
- It also automatically filters the "symbol" according to the one of the chart.
As mentioned in the description, I have to inform you of :
Warning 1 : This script only handles objects and csv files with the correct structure. It is by no mean an indicator nor an EA. It won't open or close trades for you.
By using it, you recognise I decline all responsibilities in the use you may do with it.
Warning 2 : suits for real timeframe chart. May be inaccurate for Renkos, particularly in case of more bricks in only 1 minute. May also create inaccuracies if you have lost part of the history of your broker data and want to use metatrader server data which may be slightly different. I have not debugged it about the order of the arrows. For example, if you have one trade that opens on 8th of january at 12:00 and closes at 19:00 and another one that opens at 13:00 (or even 11:00) and closes at 20:00 (or even 18:00). It may cross your trades. I have not dedicated time to this specific aspect. The only way to tackle this should be to select your Results in backtest or Account History in live, right click on it, chose save as report, copy all the trades, remove comments and activity with your balance (withdrawal or transfer), and reorganise all the columns as they are in the csv file produced when you save it through the script. I know it is a little sporty but I have not worked yet on it. I only use a macro to do all of these rearrangements in the report.
If you are developing your own strategy or improving/adapting an existing one, it can be of great use to highlight the types you want. It should help to work better with indicators to define easily where your trades are more likely to win or to lose.
For example, you can save trade arrows from a timeframed chart and load them on a Renko chart or the opposite. You can as well save them from a 5 pips Renko chart and load it on a 2.5 pips Renko chart... Open four charts to display all and on one load winning buys, below, losing buys and on the right hand side winning sells above and losing sells below. Be free to use it with no boundaries of imagination.
Please note that it works in whatever chart that contains arrows. These arrows may be made by the simulator or in real time thanks to a real account or a demo account.
Sincerely
Attached Image(s) (click to enlarge)

Attached File(s)