Disliked{quote} FL (forex lines) indicators are lurking around since long everywhere,renamed and mostly if not all repainter including old enough fl 01 or fl 001 or fl 1 is centered tmaIgnored
Good Morning, How are you. Thank you very much for your guidance.
I have seen many of your posts where you instantly tell about the indicator
and provide with the original one with name and details as just Blue rain guided me.
Great knowledge acquired
I need your help. Can you please name an indicator or provide me.
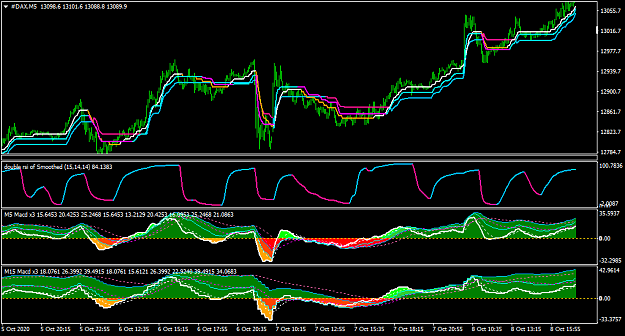
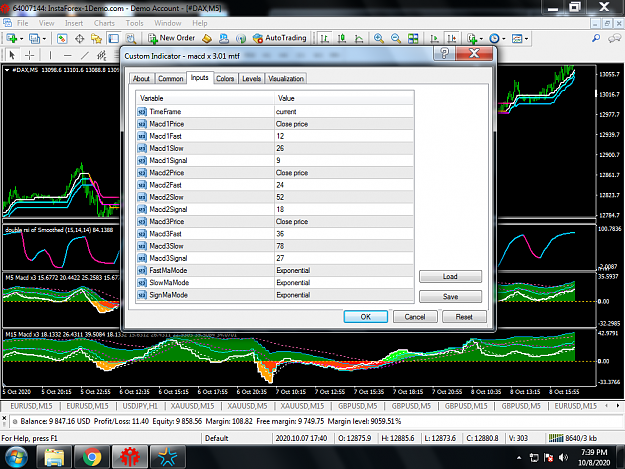
i want a nice MACD histogram Indicator with the option of Different Timeframes to plot on a single chart
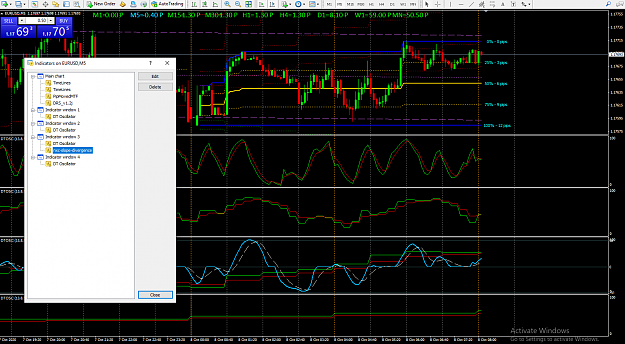
i have a stochastic indicator. I am attaching its image.
But i want of a MACD histogram Indicator with the option of Different Timeframes to plot on a single chart.
Have a Great Day
Thanks & Regards
Attached Image (click to enlarge)