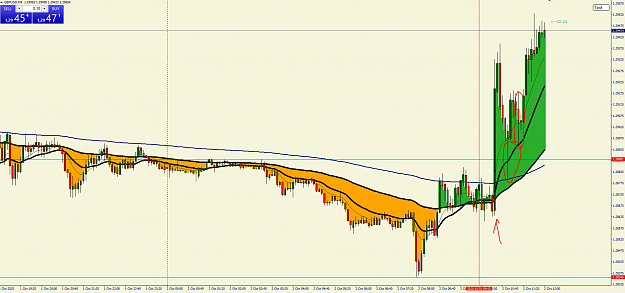
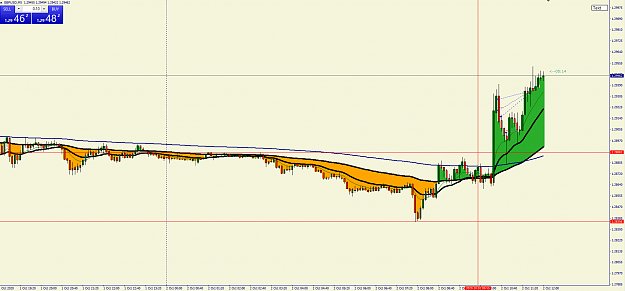
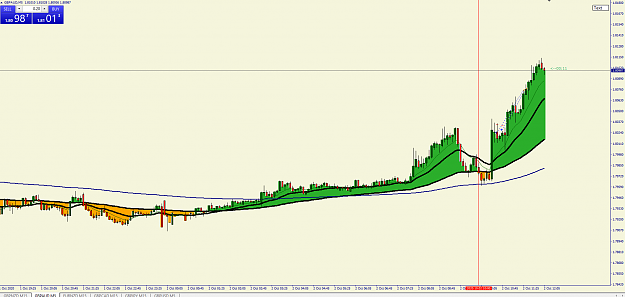
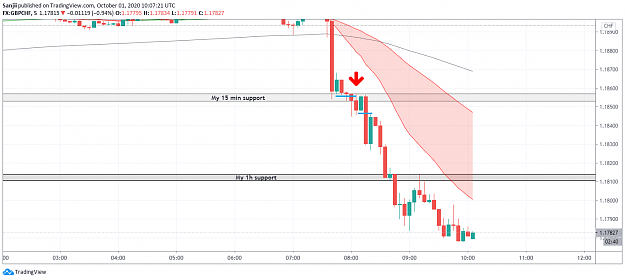
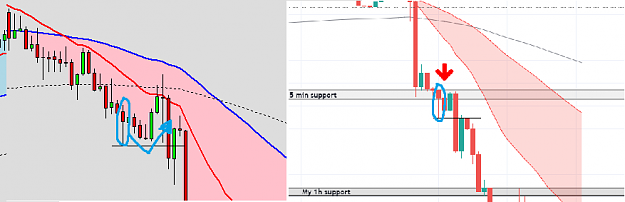
• Home
  • Forums
  • Trades
  • News
  • Calendar
  • Market
  • Brokers
  • Login
  • Join
  • User/Email: Password:
  • 5:49pm
Menu
  • Forums
  • Trades
  • News
  • Calendar
  • Market
  • Brokers
  • Login
  • Join
  • 5:49pm
Sister Sites
  • Metals Mine
  • Energy EXCH
  • Crypto Craft

Options

Bookmark Thread

First Page First Unread Last Page Last Post

Print Thread

Similar Threads

MY PASR journey Based on Strat's PASR Trading 75 replies

M5 PASR Trend Trading Strat 91 replies

Another way to stress free, mechanic long term trading 29 replies

A young trader's road to profitability - PASR trading - Live 11 replies

Fibs trading and PASR 0 replies

  • Trading Systems
  • /
  • Reply to Thread
  • Subscribe
  • 9,174
Attachments: Strat's PASR Long Term, Stress Free Trading
Exit Attachments

Strat's PASR Long Term, Stress Free Trading

  • Last Post
  •  
  • 1 674675Page 676677678 755
  • 1 Page 676 755
  •  
  • Post #13,501
  • Quote
  • Oct 1, 2020 3:20pm Oct 1, 2020 3:20pm
  •  Udkox
  • | Joined Feb 2020 | Status: Member | 72 Posts
Quoting Sanji
Disliked
{quote} Hi Udkox, Here is my entry on GBPCHF 5 min if I have time to do breakout trades. Your entry is my add-on. But you better wait for the price to pull back 20 EMA and reject it. Because of the rubber strap effect is likely to occur when the price moves sharply and away from Strat Shadow. Best regards Sanji EDIT: (Note) I also look on 15 min chart and really like this candle even though the price has rejected support before. {image} {image}
Ignored
So you enter the trade when the PRICE closes beyond SUPPORT / RESISTANCE ? That feels a bit weird. Your entry didn't make a new LOW, plus there was a HAMMER just before (on M5).

However, I do understand the PRICE has to be rejected to have a higher probability, thanks!
 
 
  • Post #13,502
  • Quote
  • Oct 1, 2020 7:11pm Oct 1, 2020 7:11pm
  •  Udkox
  • | Joined Feb 2020 | Status: Member | 72 Posts
Quoting JCMPete
Disliked
{quote} Hi Rub Take a look at post 10583 from Strat on this thread. Pay particular attention to the blue rectangle mentioned and the Strat Shadow when scrolling through different time frames. Pete
Ignored
Awesome post Pete, have you got some index on Strat's posts ?

I am looking at EUR USD at the moment trying to apply that knowledge.

Boss:
PRICE in WCC. Huge BEARISH candle finished SWING UP, now on a SWING DOWN.
Attached Image (click to enlarge)
Click to Enlarge

Name: EURUSDWeekly.png
Size: 36 KB


Worker:
PRICE in Strat's shadow, no direction. Failed to break below EMA 72.
Attached Image (click to enlarge)
Click to Enlarge

Name: EURUSDDaily.png
Size: 35 KB


If PRICE breaks below EMA 72, it might be the start of a long SWING TRADE downwards.
This makes sense to me given Strat's post. However, I worry about the Big Boss.

Big Boss:
BEARISH ENGULFING BAR on RESISTANCE, rejecting EMA 200. But PRICE is above EMA 72, which suggests UPWARD momentum.
Attached Image (click to enlarge)
Click to Enlarge

Name: EURUSDMonthly.png
Size: 38 KB


Does this discard the trade if the Worker and Boss aligned ? What are your thoughts ?

Cheers.
 
 
  • Post #13,503
  • Quote
  • Oct 1, 2020 9:58pm Oct 1, 2020 9:58pm
  •  Sanji
  • | Joined Jul 2020 | Status: Trend is your friend | 185 Posts
Quoting Udkox
Disliked
{quote} So you enter the trade when the PRICE closes beyond SUPPORT / RESISTANCE ? That feels a bit weird. Your entry didn't make a new LOW, plus there was a HAMMER just before (on M5). However, I do understand the PRICE has to be rejected to have a higher probability, thanks!
Ignored
Hi Udkox,
I pay attention to the previous candle on 15 min, close of the Hammer and the candle for my entry on 5 min (price rejected SR. Look at the next bullish candle, it does not close above the high of previous candle). This is PA at SR.

Best regards
Sanji
 
 
  • Post #13,504
  • Quote
  • Oct 2, 2020 2:50am Oct 2, 2020 2:50am
  •  JCMPete
  • | Joined May 2018 | Status: Member | 366 Posts
Quoting Udkox
Disliked
{quote} Awesome post Pete, have you got some index on Strat's posts ? I am looking at EUR USD at the moment trying to apply that knowledge. Boss: PRICE in WCC. Huge BEARISH candle finished SWING UP, now on a SWING DOWN. {image} Worker: PRICE in Strat's shadow, no direction. Failed to break below EMA 72. {image} If PRICE breaks below EMA 72, it might be the start of a long SWING TRADE downwards. This makes sense to me given Strat's post. However, I worry about the Big Boss. Big Boss: BEARISH ENGULFING BAR on RESISTANCE, rejecting EMA 200. But PRICE...
Ignored
Hi Udkox

I will try and answer your questions and comments in the order you asked them:

Have you got some index on Strat's posts ?

No, still working on it.

I am looking at EUR USD at the moment trying to apply that knowledge.

Good

Boss: PRICE in WCC.

It is in the previous WCC but price has already closed below it looking at your chart. If this week's candle closes within the WCC you marked we can take that it still applies. But the week has not closed yet so we wait and see.

Worker: PRICE in Strat's shadow, no direction.

Yes, price is stuck in the Strat Shadow.

Failed to break below EMA 72.

Instead of looking at individual EMA's look at the Strat Shadow and see how price reacts in and around it. This is really important and you need to do go back in history and across different timeframes and study this.

If PRICE breaks below EMA 72,

If PRICE breaks below the Strat Shadow

it might be the start of a long SWING TRADE downwards.

Looking at you charts it has already started but no indication yet whether is is just a wobble or if it will continue downwards.


I worry about the Big Boss. Big Boss: BEARISH ENGULFING BAR on RESISTANCE, rejecting EMA 200. But PRICE is above EMA 72, which suggests UPWARD momentum. {image} Does this discard the trade if the Worker and Boss aligned ?

The Big Boss gives you the 50000 feet view. The Boss directs the worker and the worker executes. So the question is which timeframe are you trading? Big Boss, Boss or Worker? You need to trade what you see on the time frame you are trading.

What are your thoughts ?

Just based on the charts you posted (I have not opened my own charts to check):

Big Boss:

Since 2013 Price have made a high, a low, a lower high, a higher low and now another lower high. Is that a 200EMA on your chart?

Boss:

From the low in March we now have a confirmed high

Worker

We have High, a low, a lower high and a lower low in place with price moving back up in the WCC marked (But the week have not closed yet and there is red data announcements today.) Also price is within the Strat Shadow as already mentioned.

Will Resistance hold? We will have to wait and see...


These are just my thoughts based on the charts you posted. Hope it helps.

Pete
 
2
  • Post #13,505
  • Quote
  • Oct 2, 2020 5:05am Oct 2, 2020 5:05am
  •  bistolis
  • Joined Sep 2016 | Status: Inactive | 831 Posts
this is what is important in hindsight:
Attached Image (click to enlarge)
Click to Enlarge

Name: Screenshot1.png
Size: 116 KB

and this is how it looks like when you are not experienced and trade at the right edge
Attached Image (click to enlarge)
Click to Enlarge

Name: Screenshot2.png
Size: 92 KB


plenty of mistakes there
 
1
  • Post #13,506
  • Quote
  • Oct 2, 2020 5:10am Oct 2, 2020 5:10am
  •  bistolis
  • Joined Sep 2016 | Status: Inactive | 831 Posts
sometimes you get it right
Attached Image (click to enlarge)
Click to Enlarge

Name: Screenshot1.png
Size: 93 KB
 
3
  • Post #13,507
  • Quote
  • Oct 2, 2020 5:33am Oct 2, 2020 5:33am
  •  Mhons
  • | Joined Jul 2015 | Status: Member | 278 Posts
Quoting bistolis
Disliked
this is what is important in hindsight: {image} and this is how it looks like when you are not experienced and trade at the right edge {image} plenty of mistakes there
Ignored
Profit is Profit.
Hindsight is tricky Bist totally agree )

I am making mistakes my whole life. That is learning path. The best happened to me was to get used to it.

Quote from my favourite TV show.

"This is the way"

Stay safe

MH
 
 
  • Post #13,508
  • Quote
  • Oct 2, 2020 3:58pm Oct 2, 2020 3:58pm
  •  Udkox
  • | Joined Feb 2020 | Status: Member | 72 Posts
Quoting Sanji
Disliked
{quote} Hi Udkox, I pay attention to the previous candle on 15 min, close of the Hammer and the candle for my entry on 5 min (price rejected SR. Look at the next bullish candle, it does not close above the high of previous candle). This is PA at SR. Best regards Sanji
Ignored
But you didn't know PRICE was going to REJECT the LEVEL, you entered before that.

When I look at your 5M, I don't understand your entry. These 2 (blue lines), confirmed SWING HIGHs, make more sense to me:

Attached Image (click to enlarge)
Click to Enlarge

Name: attachment.png
Size: 56 KB
 
 
  • Post #13,509
  • Quote
  • Oct 2, 2020 9:24pm Oct 2, 2020 9:24pm
  •  Sanji
  • | Joined Jul 2020 | Status: Trend is your friend | 185 Posts
Quoting Udkox
Disliked
{quote} But you didn't know PRICE was going to REJECT the LEVEL, you entered before that. When I look at your 5M, I don't understand your entry. These 2 (blue lines), confirmed SWING HIGHs, make more sense to me: {image}
Ignored
Hi Udkox,
You just need to find the entries that you are comfortable with in your trading style and what you have learned.
I look at price action before and after breaking through my 15 min support on a 5 min chart.

Best regards
Sanji
 
 
  • Post #13,510
  • Quote
  • Oct 2, 2020 9:35pm Oct 2, 2020 9:35pm
  •  peterhenders
  • Joined Jul 2013 | Status: Member | 275 Posts
What happened to Strat?
 
 
  • Post #13,511
  • Quote
  • Oct 3, 2020 6:37am Oct 3, 2020 6:37am
  •  Udkox
  • | Joined Feb 2020 | Status: Member | 72 Posts
Quoting Sanji
Disliked
{quote} Hi Udkox, You just need to find the entries that you are comfortable with in your trading style and what you have learned. I look at price action before and after breaking through my 15 min support on a 5 min chart. Best regards Sanji
Ignored
Of course, maybe I am not understanding when you entered. I am assuming you entered after the close of the candle you indicated.

In that case, I was trying to understand the idea behind your trade.

HAMMERS are PRICE REVERSAL patterns, and you entered right after it, on a BEARISH candle that doesn't have any significant meaning to me.

Where did you have your SL ?

Attached Image (click to enlarge)
Click to Enlarge

Name: sanji.png
Size: 24 KB


Quoting peterhenders
Disliked
What happened to Strat?
Ignored
He's not been active lately. I think he sometimes reads the posts.
 
 
  • Post #13,512
  • Quote
  • Oct 3, 2020 6:51am Oct 3, 2020 6:51am
  •  Sanji
  • | Joined Jul 2020 | Status: Trend is your friend | 185 Posts
Quoting Udkox
Disliked
{quote} Of course, maybe I am not understanding when you entered. I am assuming you entered after the close of the candle you indicated. In that case, I was trying to understand the idea behind your trade. HAMMERS are PRICE REVERSAL patterns, and you entered right after it, on a BEARISH candle that doesn't have any significant meaning to me. Where did you have your SL ? {image} {quote} He's not been active lately. I think he sometimes reads the posts.
Ignored
Hi Udkox,
My entry is below the low of that Hammer. I will delete sell stop order if I see a bullish candle close above my support.

Best regards
Sanji
 
1
  • Post #13,513
  • Quote
  • Edited at 7:09pm Oct 3, 2020 3:02pm | Edited at 7:09pm
  •  Udkox
  • | Joined Feb 2020 | Status: Member | 72 Posts
Quoting JCMPete
Disliked
{quote} Hi Udkox I will try and answer your questions and comments in the order you asked them [...] Hope it helps. Pete
Ignored
Thanks Pete. I will do the same.

Looking at you charts it has already started but no indication yet whether is is just a wobble or if it will continue downwards.

What do you need to see to discard it being a wobble ? The BOSS crossing the 72 EMA ?

The Big Boss gives you the 50000 feet view. The Boss directs the worker and the worker executes. So the question is which timeframe are you trading? Big Boss, Boss or Worker? You need to trade what you see on the time frame you are trading.

Of course but BIG BOSS and BOSS have to be aligned:

Quoting strat
Disliked
Knowing the direction of the BIG BOSS, we review the BOSS. If the BOSS is fighting the BIG BOSS, it will be very difficult to trade so we WAIT until the BOSS aligns herself with the BIG BOSS. With the BIG BOSS and BOSS now in harmony (both moving together in the same direction) we drop down to the Worker.
Ignored
I am not sure whether the BIG BOSS and the BOSS are aligned. Is that BEARISH ENGULFING BAR in the BIG BOSS enough to say it's headed DOWNWARDS ?

Is that a 200EMA on your chart?

Yes.

Hope the questions are clear.
Thanks again.
 
1
  • Post #13,514
  • Quote
  • Oct 3, 2020 10:00pm Oct 3, 2020 10:00pm
  •  Sanji
  • | Joined Jul 2020 | Status: Trend is your friend | 185 Posts
Quoting Udkox
Disliked
{quote} Thanks Pete. I will do the same. Looking at you charts it has already started but no indication yet whether is is just a wobble or if it will continue downwards. What do you need to see to discard it being a wobble ? The BOSS crossing the 72 EMA ? The Big Boss gives you the 50000 feet view. The Boss directs the worker and the worker executes. So the question is which timeframe are you trading? Big Boss, Boss or Worker? You need to trade what you see on the time frame you are trading. Of course but BIG BOSS and BOSS have to be aligned: {quote}...
Ignored
Hi Udkox,

My English is not good so I don't understand your questions very well, a few times I use google translate to understand what people post.
About the trend, in my experience, I look for Boss immediate trend, if can't see it, I ignore that pair, usually I determine what is current Swing? And where are the prices compared to the nearest levels? For Big Boss, I only look for where prices are relative to the nearest levels. I also looked at the recent price action on Boss and Big Boss. I don't trade as much as I used to, I mainly choose entries for which I feel quality and comfortable. You can review trade on EURUSD I posted.

Best regards
Sanji
 
1
  • Post #13,515
  • Quote
  • Oct 7, 2020 6:34pm Oct 7, 2020 6:34pm
  •  Udkox
  • | Joined Feb 2020 | Status: Member | 72 Posts
This looks quiet, so here I come! Hopefully my commets will trigger some of you!

Currently looking at GBP JPY, my levels might be wrong.

Big Boss:
Making LOWER HIGHS since May 2015. Nice steady slope DOWNWARDS, respecting Strat's shadow. BEARISH ENGULFING BAR hints PRICE might drop further. It already hit SUPPORT and bounced though.

Attached Image (click to enlarge)
Click to Enlarge

Name: GBPJPYMonthly.png
Size: 36 KB


Boss:
Currently in an UPWARDS SWING. Nice HAMMER followed by a decent BULLISH candle, however, EMAs have no slope and PRICE is in the Strat's shadow. PRICE was rejected at Strat's shadow, let's see where it closes this week.

Attached Image (click to enlarge)
Click to Enlarge

Name: GBPJPYWeekly.png
Size: 37 KB


Worker:
Directionless, flat EMAs. If it breaks on the downside, there might be a setup.

Attached Image (click to enlarge)
Click to Enlarge

Name: GBPJPYDaily.png
Size: 39 KB
 
2
  • Post #13,516
  • Quote
  • Oct 8, 2020 7:28pm Oct 8, 2020 7:28pm
  •  Udkox
  • | Joined Feb 2020 | Status: Member | 72 Posts
Here I come with another post! Let's see if someone comments on this one!

Be skeptical of my levels.

NZD USD: currently directionless, a setup might show up if PRICE drops.

Big boss:
On a nice DOWNTREND for years, but on a SWING UPWARDS right now. PRICE bounced off the STRAT's SHADOW a few times, but then entered it. PRICE bounced off MONTHLY RESISTANCE and is now stuck, therefore no clear direction. Monthly RESISTANCE and DYNAMIC RESISTANCES EMA 200 & EMA 72 right above PRICE.
Attached Image (click to enlarge)
Click to Enlarge

Name: NZDUSDMonthly.png
Size: 67 KB


Boss:
Flat EMA 72 & 20. Technically on a SWING DOWNWARDS, due to the massive BEARISH ENGULFING BAR, but direction not clear. PRICE inside the WCC.
Attached Image (click to enlarge)
Click to Enlarge

Name: NZDUSDWeekly.png
Size: 50 KB


Worker:
Double failed attempt to break the MONTHLY RESISTANCE. Technically on a DOWNWARDS SWING, but EMAs are flattening, and PRICE is getting in and out the STRAT's SHADOW. PRICE has been in a range for a while, it seems ready to break in some direction. The next low will be very interesting to watch.
Attached Image (click to enlarge)
Click to Enlarge

Name: NZDUSDDaily.png
Size: 58 KB


If PRICE drops below the WCC, there should be opportunities to trade lower timeframes.

Looking forward to your comments.
 
 
  • Post #13,517
  • Quote
  • Oct 9, 2020 2:58am Oct 9, 2020 2:58am
  •  Sanji
  • | Joined Jul 2020 | Status: Trend is your friend | 185 Posts
Quoting Udkox
Disliked
Here I come with another post! Let's see if someone comments on this one! Be skeptical of my levels. NZD USD: currently directionless, a setup might show up if PRICE drops. Big boss: On a nice DOWNTREND for years, but on a SWING UPWARDS right now. PRICE bounced off the STRAT's SHADOW a few times, but then entered it. PRICE bounced off MONTHLY RESISTANCE and is now stuck, therefore no clear direction. Monthly RESISTANCE and DYNAMIC RESISTANCES EMA 200 & EMA 72 right above PRICE. {image} Boss: Flat EMA 72 & 20. Technically on a SWING DOWNWARDS, due...
Ignored
Hi Udkox,
BB is undecided yet, so I'll wait, I'm biased on short for this pair on lower timeframes like you.

Best regards
Sanji
 
 
  • Post #13,518
  • Quote
  • Oct 9, 2020 3:17am Oct 9, 2020 3:17am
  •  Sanji
  • | Joined Jul 2020 | Status: Trend is your friend | 185 Posts
Quoting Udkox
Disliked
Here I come with another post! Let's see if someone comments on this one! Be skeptical of my levels. NZD USD: currently directionless, a setup might show up if PRICE drops. Big boss: On a nice DOWNTREND for years, but on a SWING UPWARDS right now. PRICE bounced off the STRAT's SHADOW a few times, but then entered it. PRICE bounced off MONTHLY RESISTANCE and is now stuck, therefore no clear direction. Monthly RESISTANCE and DYNAMIC RESISTANCES EMA 200 & EMA 72 right above PRICE. {image} Boss: Flat EMA 72 & 20. Technically on a SWING DOWNWARDS, due...
Ignored
Hi Udkox,
I will find another pair, BB and B show me there won't be a good entry on this pair, I'll wait for the next PA.
Recently, when analyzing, I often remember Strat's post 10583 that Pete mentioned. It is a wonderful blue rectangle.

Best regards
Sanji
 
1
  • Post #13,519
  • Quote
  • Oct 9, 2020 5:41am Oct 9, 2020 5:41am
  •  JCMPete
  • | Joined May 2018 | Status: Member | 366 Posts
Quoting Udkox
Disliked
{quote} Thanks Pete. I will do the same. Looking at you charts it has already started but no indication yet whether is is just a wobble or if it will continue downwards. What do you need to see to discard it being a wobble ? The BOSS crossing the 72 EMA ? The Big Boss gives you the 50000 feet view. The Boss directs the worker and the worker executes. So the question is which timeframe are you trading? Big Boss, Boss or Worker? You need to trade what you see on the time frame you are trading. Of course but BIG BOSS and BOSS have to be aligned: {quote}...
Ignored
Hi Udkox

Below are a few extracts I made from Strat posts that may help you:

Study and understand the image below:
Attached Image


Which Trend ?

Let's first just make sure we understand that even within one time frame there are several trends. We must establish what the dominant trend is and to do that, zoom out as far as you can go and it should be obvious. I have done this on eurusd weekly and you can see the dominant trend is UP as shown by the deep sky blue channel line.

Then zoom in to find the intermediate trend as shown by the magenta line.

Then zoom into that trend to find the short term trend as shown by the gold line.

Then zoom into that trend to find the immediate trend as shown by the lime green line.

You need to be aware of all these trends when trading the Worker to know whether you are with or against the trend.

So, to trade the Worker, you need to know the IMMEDIATE BOSS trend since this governs the Worker direction.

Remember also that if you draw TLs as I do, you can use them as your Momentum indicators which tell you far more than a squiggly line.

So, where we are today on the BOSS, the IMMEDIATE trend is DOWN but it is at the cross - roads of it's short term trend meaning that something has to give. Whichever way this breaks IS the IMMEDIATE trend and will provide direction for the Worker.

Don't forget that even 3 bars on the BOSS is 15 bars on the Worker.


Attached Image
Attached Image
Attached Image
Attached Image
 
4
  • Post #13,520
  • Quote
  • Oct 9, 2020 11:08pm Oct 9, 2020 11:08pm
  •  deked
  • | Joined Jun 2020 | Status: Member | 19 Posts
im very interested in this but with 676 pages, can anyone give me an idea of what i need to read and download. is there a trading pdf or mt4 adddons + template, or maybe traadingview?
anything to help

I've set up zones myself before and traded tweezer tops and bottoms and key levels with some success, but the issue i found was consistency.
 
 
  • Trading Systems
  • /
  • Strat's PASR Long Term, Stress Free Trading
  • Reply to Thread
    • 1 674675Page 676677678 755
    • 1 Page 676 755
1 trader viewing now
  • More
Top of Page
Forex Factory Blog Updated: Alerting All Members
  • Facebook
  • Twitter
About FF
  • Mission
  • Products
  • User Guide
  • Media Kit
  • Blog
  • Contact
FF Products
  • Forums
  • Trades
  • Calendar
  • News
  • Market
  • Brokers
  • Trade Explorer
FF Website
  • Homepage
  • Search
  • Members
  • Report a Bug
Follow FF
  • Facebook
  • Twitter

FF Sister Sites:

  • Metals Mine
  • Energy EXCH
  • Crypto Craft

Forex Factory® is a brand of Fair Economy, Inc.

Terms of Service / ©2022