Here is my trade for this week, I am a little embarrassed by this trade because of how late I am to taking it.
As far as my position size its fairly small, because of how exposed I feel on it.
Everything is on Daily, I'm not the best at looking at all of the time frames available to me, but this is a great example that even if you scalp a M1 chart that its worth at least glancing at the higher time frames.
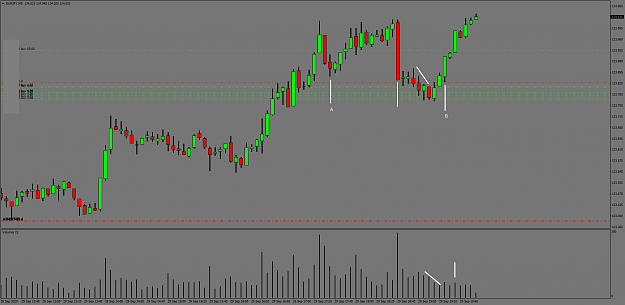
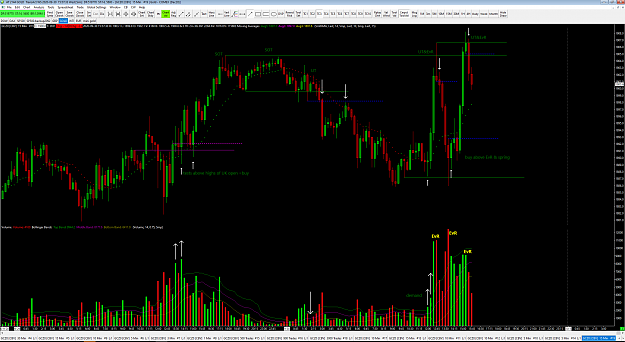
A) High volume comes in.
B) Test, checking for sellers, but to be honest really the past 3 days were testing as well.
C) Shakeout, I think I use the term shakeout too loosely. Shakeouts really need to make a new low, the purpose of shakeouts are to literally shake out buyers who entered in too early, which bar C triggered a number of stops from the buyers on the previous bars.
See what price looks like at 124.50, but keeping an open mind for a prices above 125.00
{quote}...keep in mind is that September and December are notorious months for seeing extreme overbought or oversold conditions. Be careful about picking tops and bottoms.... {image}
Ignored
Especially on the commodity pairs, last week they saw extreme OS/OB conditions, and this week doesn't seem to be any different. Classic September behavior, just wasn't expecting it to happen at the very end of the month.
Either way, expect more of the same in December, which I'll probably be absent a large portion of Nov-Jan.
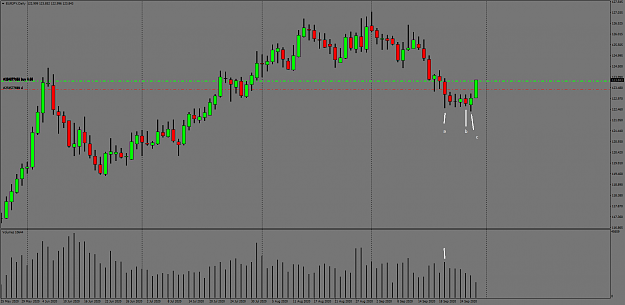
Normally a widespread down bar at the highs is bearish. That widespread down bar probably frightened a lot of buyers out of their positions as well. Here's the thing, wide spread down bars on the highs, usually take out support.
That downbar barely pushed below support at Bar A. Price started coming down a few bars later after the down bar, but on decreasing volume (big surprise). We see an increase in volume on an up bar. Look at the increase in volume, its just noticeable, its not excessive, its healthy buying.
Scalp long, close scalps when the high is taken out.
Just keep in mind the background, currencies are in extreme OB/OS conditions, look at H1 on this chart and you see how aggressive EJ has been moving up today, this is the reason why you can buy the tops. Normal market conditions where currencies are a little more range prone, and this trade would be a guaranteed loss.
Here is my trade for this week, I am a little embarrassed by this trade because of how late I am to taking it. As far as my position size its fairly small, because of how exposed I feel on it. Everything is on Daily, I'm not the best at looking at all of the time frames available to me, but this is a great example that even if you scalp a M1 chart that its worth at least glancing at the higher time frames. A) High volume comes in. B) Test, checking for sellers, but to be honest really the past 3 days were testing as well. C) Shakeout, I think I...
Ignored
Moved stop to BE at 123.80, buyers aren't going to give sellers on inch on this move.
Plan on dumping 1/4 of the position somewhere around 124.50, and hold the rest for 125.00+. Other than that, calling it a week.
I am getting my fair share of PMs, and I just want to reiterate on learning VSA, that you honestly only need two resources. The first and most important is the book Master the Markets, which by the way is given away for free by Tradeguider.
The second is this thread, there are a lot of great contributors to this thread, its worth reading and you will pick up very quickly who you should pay close attention to. Malcolmb14, HiddenGap, Intel and Pres78 are just to name a few, but there are soo many more!
And lastly don't be afraid to post charts, this thread isn't toxic.
{quote} Moved stop to BE at 123.80, buyers aren't going to give sellers on inch on this move. Plan on dumping 1/4 of the position somewhere around 124.50, and hold the rest for 125.00+. Other than that, calling it a week.
Ignored
Stop hit and taken out completely. I did make a little bit on the scalp when price pushed 124.00
I might have moved stop too soon, but the biggest issue was getting in late. Should have hammered this trade around 123.45, either way every trade can't be a home run.
Normally a widespread down bar at the highs is bearish. That widespread down bar probably frightened a lot of buyers out of their positions as well. Here's the thing, wide spread down bars on the highs, usually take out support. That downbar barely pushed below support at Bar A. Price started coming down a few bars later after the down bar, but on decreasing volume (big surprise). We see an increase in volume on an up bar. Look at the increase in volume, its just noticeable, its not excessive, its healthy buying. Scalp long, close scalps when the...
Ignored
Nice chart, with great trades as usual!
I think with Weiss wave you would step up your game even more.
{quote} I'll have to do some reading on weis wave, don't know really know anything about it. thanks.
Ignored
read David Weiss book- trades about to happen, thats my favorite trading book (chapter 10 is about waves). have read 10+ on wyckoff, VSA, volume and this is by far the best one.
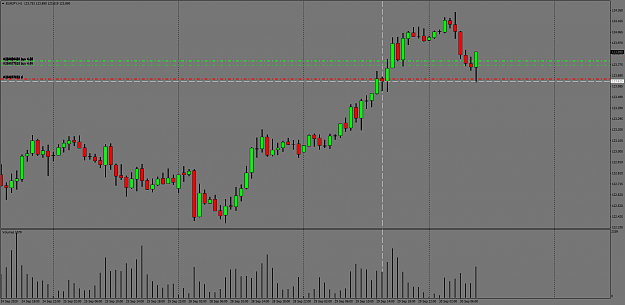
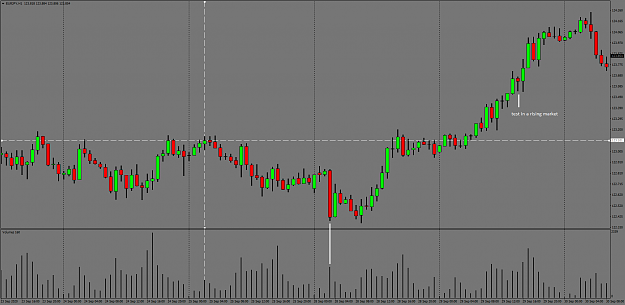
Went back into EJ with a few small trades. This is really just me playing with the pair. Yesterday there was a test in a rising market, price tagged the trigger number and went straight up. {image}
Ignored
This was stopped out.. really am calling it a week now, take care.
{quote} This was stopped out.. really am calling it a week now, take care.
Ignored
we had a reaction on previous weeks highs and the down wave during asia was supply. it was the biggest down wave for the last 7 days (no need for weiss wave to spot that, just chart time and open mind). miss these things often myself, thats why i use trend channels (prefer wyckoff terminology (and drawing style)- supply and demand lines), but they help to easier spot COB (change of behavior) if we speak about wave length.
p.s.
why calling it a week so fast, its still only Wednesday?
cant remember the time when gold was so good as today. its not the easiest asset to trade and as i prefer tight SL i often got stopped out. yesterday was stopped out 2 times before i got in the runner, but today perfect wyckoff schematics.
had 3 trades and all winners, but there was 6 possible, just was not on the charts at the right time and some of them were riskier.
{quote} why calling it a week so fast, its still only Wednesday?
Ignored
I like having the time off.
Besides I'm a very aggressive trader, most of the trades I take I'm able to get 20-40% returns (I've posted a lot of live trades in this thread showing returns). Being that aggressive there isn't any good reason to trade everyday, so I'm actively trying to cut back to a handful of trades a month.
As far as EJ, I guess there is supply coming in from the previous week high. I'm just looking at daily, with 6 days of accumulation below us, I'd be surprised if it only yielded a 130 pip rally.
{quote} Stop hit and taken out completely. I did make a little bit on the scalp when price pushed 124.00 I might have moved stop too soon, but the biggest issue was getting in late. Should have hammered this trade around 123.45, either way every trade can't be a home run.
Ignored
Hi Anotan,
I enjoyed your analysis very much. Especially your chart only uses volume. I am pursuing a PASR strategy to follow in the Big Boys' footsteps. After reading MTM, I found VSA really useful. I'm still studying VSA. But I found the volume to vary between brokers. How do I know which broker volume is correct?
{quote} Hi Anotan, I enjoyed your analysis very much. Especially your chart only uses volume. I am pursuing a PASR strategy to follow in the Big Boys' footsteps. After reading MTM, I found VSA really useful. I'm still studying VSA. But I found the volume to vary between brokers. How do I know which broker volume is correct? Best regards Sanji
Ignored
VSA uses relative volume, so volume doesn't have to be exactly the same from broker to broker.
I've talked a bit out what I call, expansion volume, in my posts. Expansion volume is usually the same on any broker.
{quote} VSA uses relative volume, so volume doesn't have to be exactly the same from broker to broker. I've talked a bit out what I call, expansion volume, in my posts. Expansion volume is usually the same on any broker.
Because the cross is euro and jpy, I would watch volume on the aisan and euro sessions.
On Sep 28, that down bar during the asian session is what I would call expansion volume, compare that volume to the previous bar its like someone hitting a light switch from off to on. Professionals were active on that bar.
There is a trigger number from the Sep 25th asia session, which I didnt see in real time. I saw the test in a rising market on the 29th and started back tracking the strength on the pair.
{quote} I like having the time off. Besides I'm a very aggressive trader, most of the trades I take I'm able to get 20-40% returns (I've posted a lot of live trades in this thread showing returns). Being that aggressive there isn't any good reason to trade everyday, so I'm actively trying to cut back to a handful of trades a month. As far as EJ, I guess there is supply coming in from the previous week high. I'm just looking at daily, with 6 days of accumulation below us, I'd be surprised if it only yielded a 130 pip rally.
Ignored
makes sense, thats why I also have many hobbies to clear the mind. not always more screen time leads to more profits.
yeah, big respect for you that you are so aggressive and i like that you keep them open for longer periods. i personally dont understand the 1% risk in the trade, only if you are learning. if you know your stuff i think it should be 5-10% per trade or in some cases even more.
I see that you stack your positions a lot, is there some reasoning/technique how you do it?
p.s.
speaking about EJ, after such down wave we usually need to see more SOW to sell it (for long term), the biggest down wave in 7 days is just a sign of possible COB, we can have choppy conditions for a while and then move up. in these cases, i prefer to see EvR or lack of supply or demand to continue buying it. yesterday weiss wave gave good EvR 2 times on the lows, the reaction to that was good too.
p.s.s.
is there some reason why you dont trade indices? to my mind, they move better than FX crosses. I used to trade currencies alone, but now the only one i trade is gbp. prefer dax, dow and nasdaq. and with your balls to keep the position open for several days you could get very good swings.