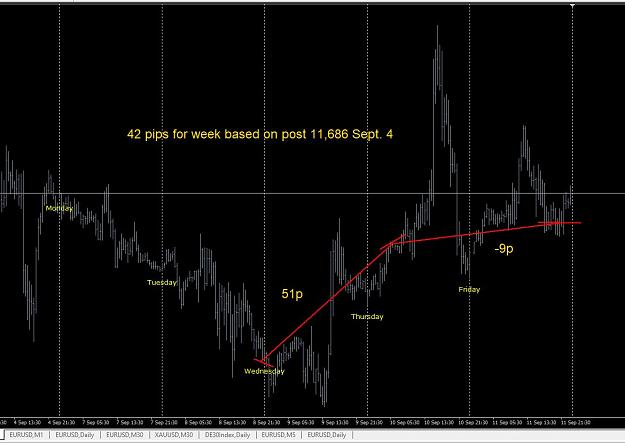
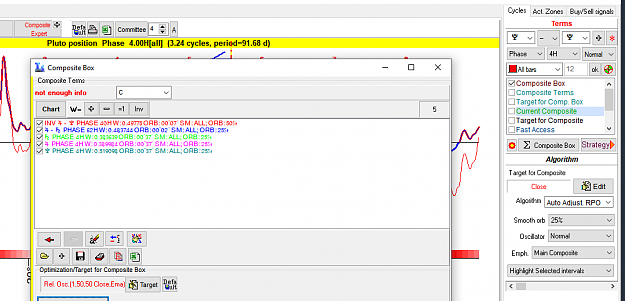
1. Weakening of price until 05:30 Monday
2. Strengthening or sideways from 05:30 to 17:30 Wednesday
3. Short 17:30 Wed until Friday morning, NY open or 16:00
4. Close trade or go long into the close if price seeps to be strengthening.
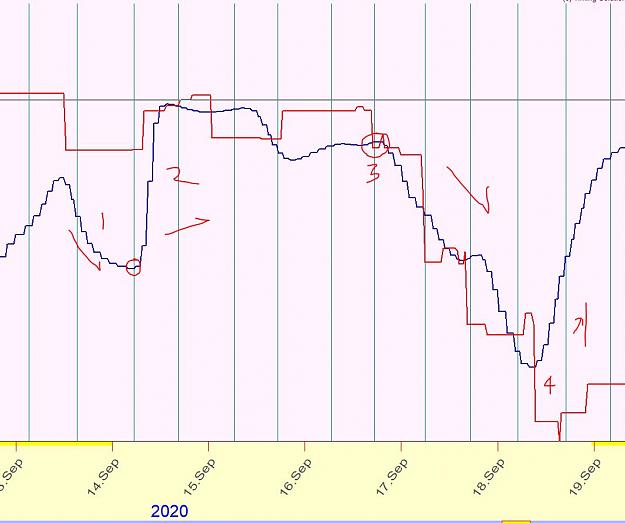
Blue line is the moon cycle, 1/5h, 5% sm orb
Red line is Dynamic Neural Net based on the Sun having 341 inputs
Vertical lines are 7 degree moon increments relative to the Sun/52
thanks I do like the layout of this programme and have become quite familiar with it . i have input the longitude and latitude for Sydney and Melbourne a few times and tested this . the drop down time zone box is a bit confusing . I assume if I am in Melbourne I would select EST but there is no option to select this from recollection . what I may do is set a particular date time and location for the astrolog programme and cross check this against the same chart calculation prepared in Astrodienst which is very accurate and see if there are any differences . regards grant
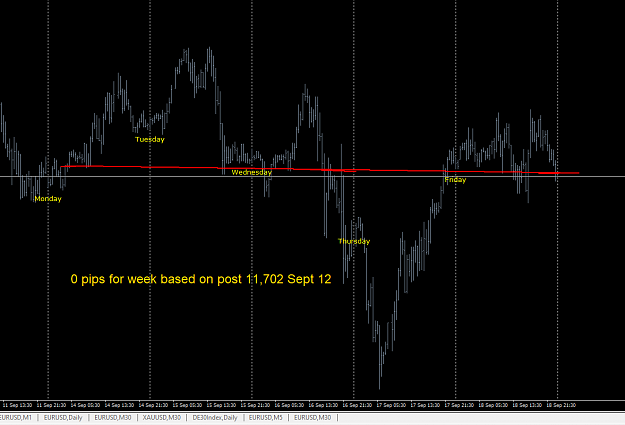
End of the week recap: 0 pips for week based on post 11,702, Sept 11. The points predicted by the moon-sun projection line turned out to be flat across the whole week...
{quote} Could you use your software to try to make a GBPUSD chart also? Maybe others would appreciate it, too. Thanks!
Ignored
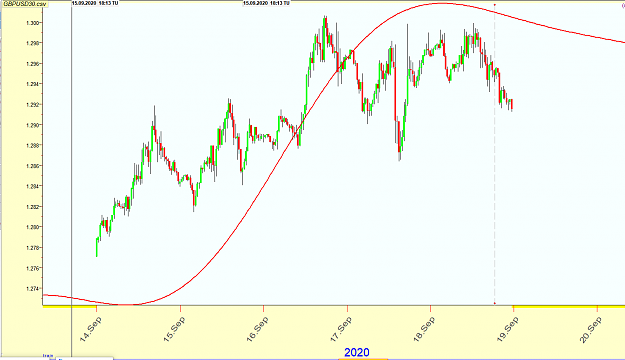
I wouldn't trust the chart too much as I haven't studied and back tested projections lines for that pair... Here is a spectrum study for GU but an astronomy projection line would take a lot more time to study.... Spectrum might be a good start though. GU 30 min UTC +3
2nd chart is view of same calculation on last week's price action...
{quote} Could you use your software to try to make a GBPUSD chart also? Maybe others would appreciate it, too. Thanks!
Ignored
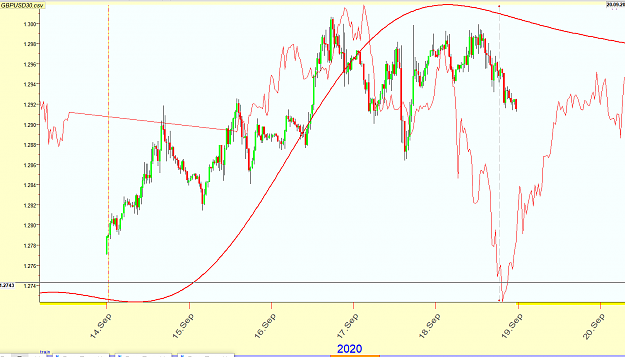
I just performed an intermarket analysis between the EU and GU and found a high correlation of the EU leading the GU by 75 bars (30 min data)... In other words, the GU will follow what the EU is doing now in another 75 bars
{quote} I just performed an intermarket analysis between the EU and GU and found a high correlation of the EU leading the GU by 75 bars (30 min data)... In other words, the GU will follow what the EU is doing now in another 75 bars {image}
Ignored
Thanks, much appreciated!
Everyone can see the chart, but only a few can actually read it.
Thanks Jnevins I just setup a Geocentric Chart on Astrolog for the 2oth September 2020 12.00PM Sydney Longitude 151.20 Deg East and Latitude 33.86 North and setup exactly the same Chart in Astrodienst and the Geo positions of the minor and major Planets are in line but the Moon Astrolog is at 13Deg Scorpio and in the Astrodienst Chart the moon is positioned at 4 Deg Scorpio which is about 15hours difference so for intraday timing this could be an issue . regards Grant
Thanks Jnevins I just setup a Geocentric Chart on Astrolog for the 2oth September 2020 12.00PM Sydney Longitude 151.20 Deg East and Latitude 33.86 North and setup exactly the same Chart in Astrodienst and the Geo positions of the minor and major Planets are in line but the Moon Astrolog is at 13Deg Scorpio and in the Astrodienst Chart the moon is positioned at 4 Deg Scorpio which is about 15hours difference so for intraday timing this could be an issue . regards Grant
Ignored
It has been awhile since I used Astrolog to decide which planets to build a projection line with... your prompt allowed me to look again at the stellium in Capricorn of Saturn, Pluto and Jupiter... Here is a projection line constructed with these planets and averaged together...
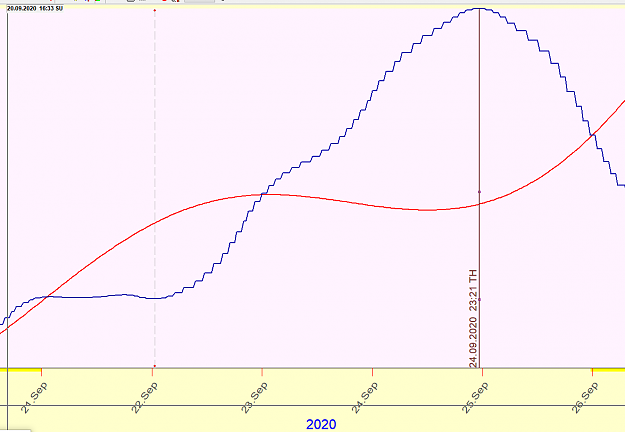
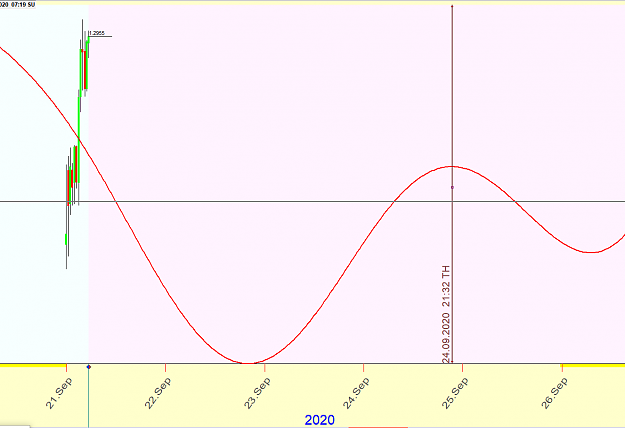
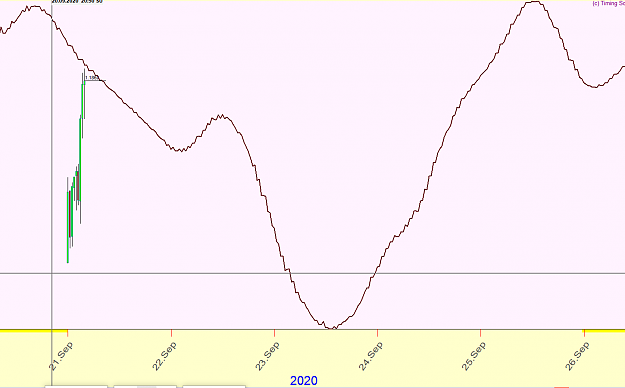
First look for next week... This is a Sun enters new house week... in this case Leo... I have observed inversions when this occurs... The low on the curve is the high for the week, etc... Will do more analysis with the Astronomy Composite module to refute or confirm... The green vertical lines are of Sun square Uranus on the 25th and Sun opposite Mars early on the 27th. New chart (#2) Sunday night... In agreement with princesammy.... Green lines are Moon entering each house. Red line is Q Spectrum/ Settings are in image #3 {image} {image} {image}...
Ignored
Hi Jnevins,
Could you pls throw some light on what “Inversions” mean. Thanks in advance.
{quote} I wouldn't trust the chart too much as I haven't studied and back tested projections lines for that pair... Here is a spectrum study for GU but an astronomy projection line would take a lot more time to study.... Spectrum might be a good start though. GU 30 min UTC +3 2nd chart is view of same calculation on last week's price action...
Attached Image (click to enlarge)
Ignored
GU worked out almost perfect this week, contrary to EU. It would be great if you did both every week.
Everyone can see the chart, but only a few can actually read it.
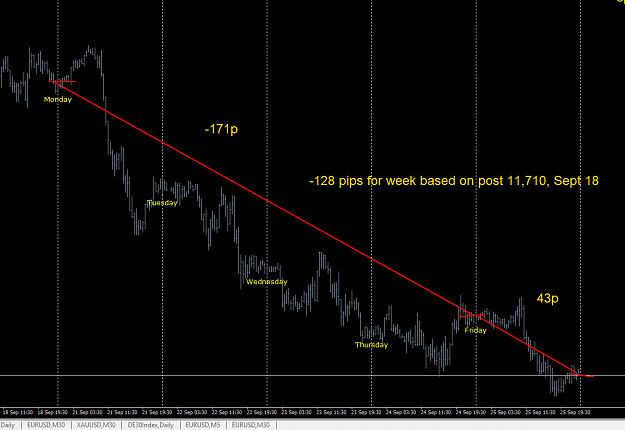
End of the week recap.... -128pips based on post 11,710...
The Tuesday morning update proved to be more accurate using the composite of the planets in Capricorn forming a stellium. Post 11,717with the same amt in the plus column.